
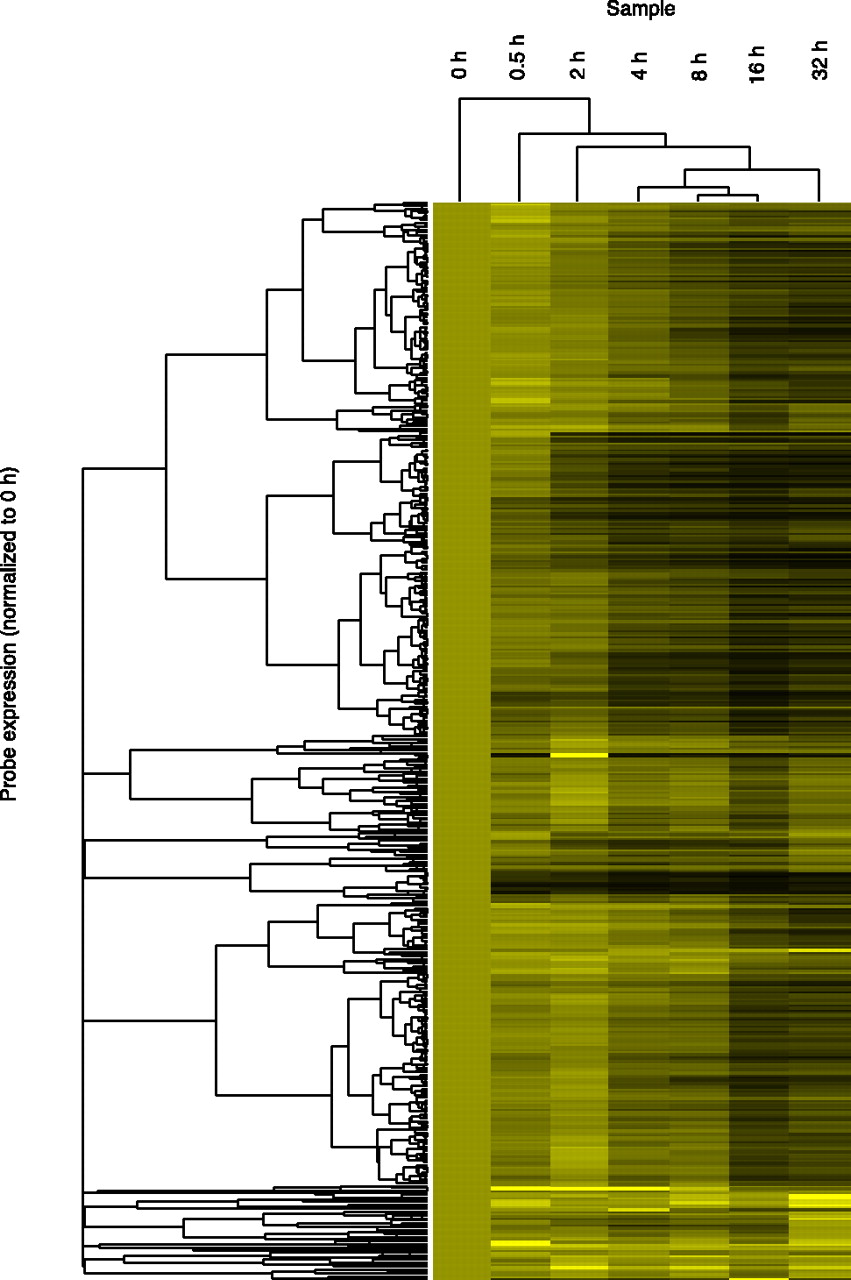
Figure 3.
Hierarchical clustering of transcript decay rates. Unsupervised hierarchical clustering of all lncRNA transcripts above the expression cut-off. Clustering was performed using cluster3 (de Hoon et al. 2004) and visualized in Java Treeview (Saldanha 2004). All transcripts were set to an expression level of 1 at 0 h, so clustering is determined only by decay rate. Transcripts that decay quickly turn black during the early time points; transcripts that show no degradation remain bright yellow. As clustering was performed on all transcripts above the expression cut-off, transcripts whose half-lives could not be determined are also included.


