
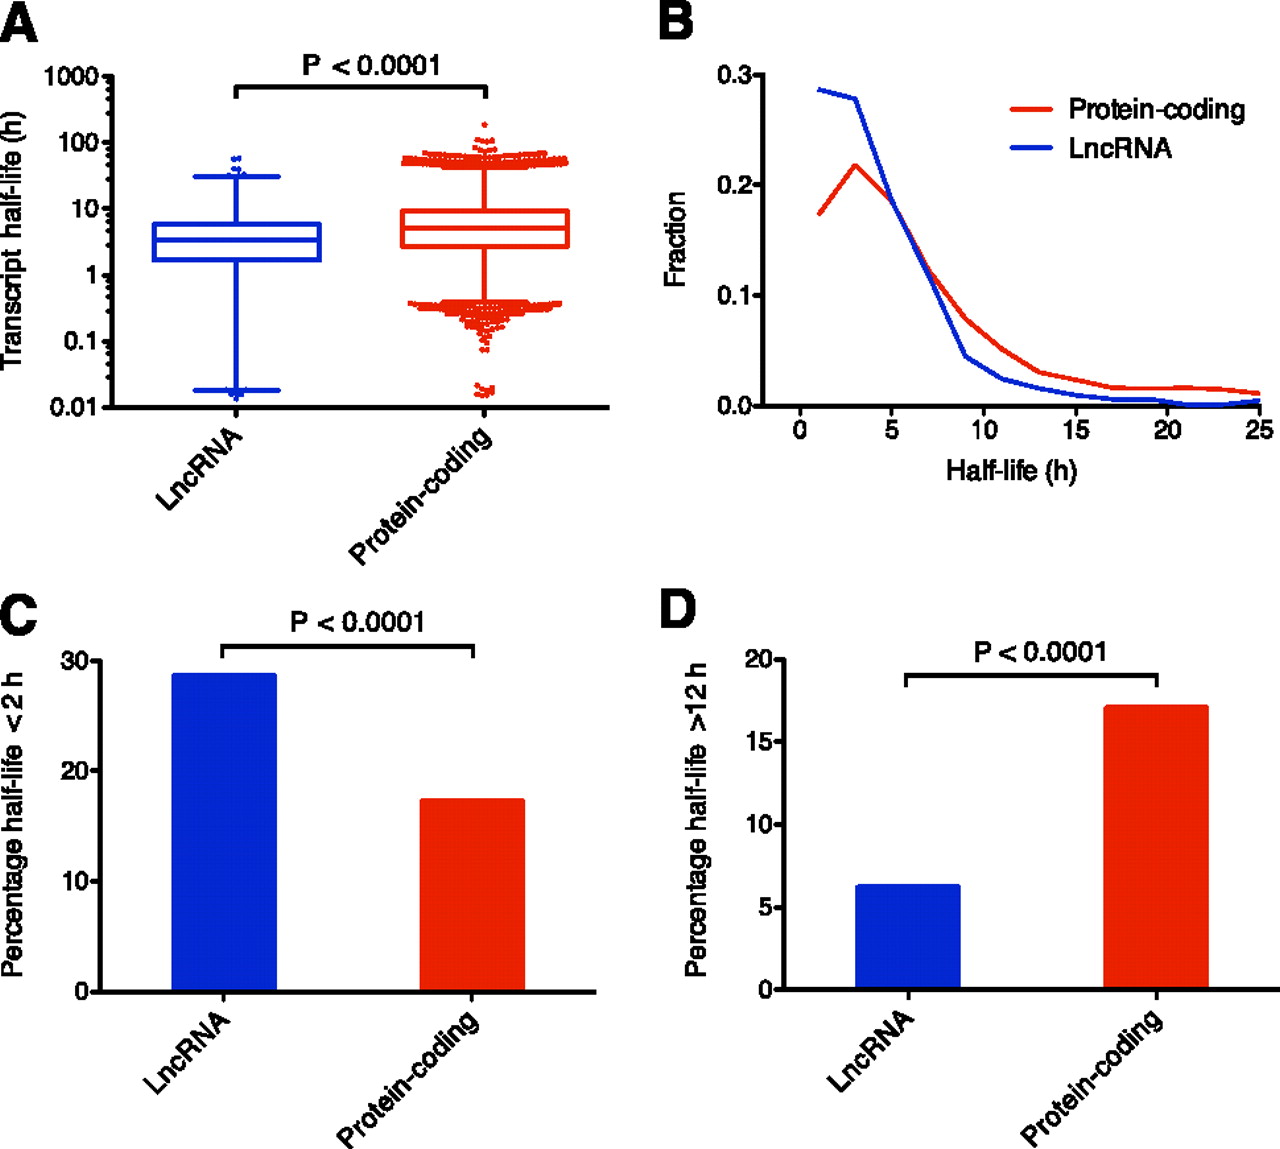
Half-lives of lncRNA and protein-coding transcripts. (A) Box-and-whisker plot of coding and lncRNA transcript half-lives. (Whiskers) 1st–99th percentile, with individual transcripts outside this shown as dots. (Box) 25th–75th percentile. Difference calculated using a nonparametric Mann-Whitney t-test. (B) Frequency distribution showing the fraction of protein-coding and lncRNA transcripts in 2-h bins. Plotted points are at the center of the 2-h bin. Only time points with 1% or more of transcripts are plotted. (C) Percentage of unstable (half-life under 2 h) lncRNA and protein-coding transcripts. Significant difference calculated using a χ2 test. (D) Percentage of highly stable (half-life over 12 h) lncRNA and protein-coding transcripts. Significant difference calculated using a χ2 test.


