
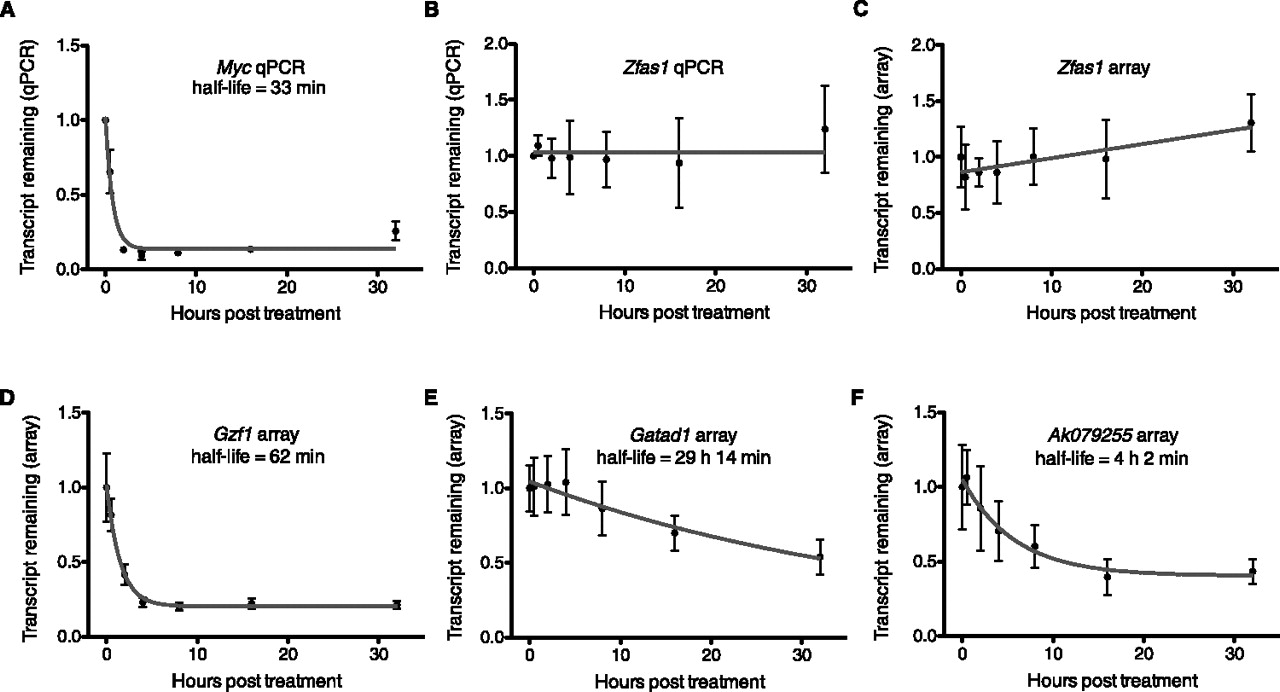
RNA half-life determination following transcription inhibition. (A,B) Transcript decay curves after blocking transcription in N2A with actinomycin D and measuring transcript remaining relative to a control gene by qPCR. Error bars show standard deviation. (A) Myc decay relative to Gapdh. Gapdh is a suitable control gene for transcripts that are not highly stable. Results are from four biological replicates, which were subsequently used for microarray analysis. The fitted curve was modeled by one-phase decay using nonlinear least squares regression. Myc expression was also tested in mock treated time courses, which did not show evidence of transcript decay. (B) Transcript decay curve for Zfas1 relative to Atp5e. Results from three biological replicates. No degradation is observed, and nonlinear regression supports a horizontal line fit. (C) Zfas1 expression over 32-h time course following transcription inhibition from microarray. Four biological replicates; error bars show standard deviations. Nonlinear regression was used to test model fits and supports a linear fit with a positive slope showing apparent up-regulation of expression by 32 h. (D–F) Decay curves and half-lives determined for two random mRNAs (D,E) and one lncRNA (F) transcript from microarrays. All were modeled using one-phase exponential decay. Error bars represent standard deviations.


