
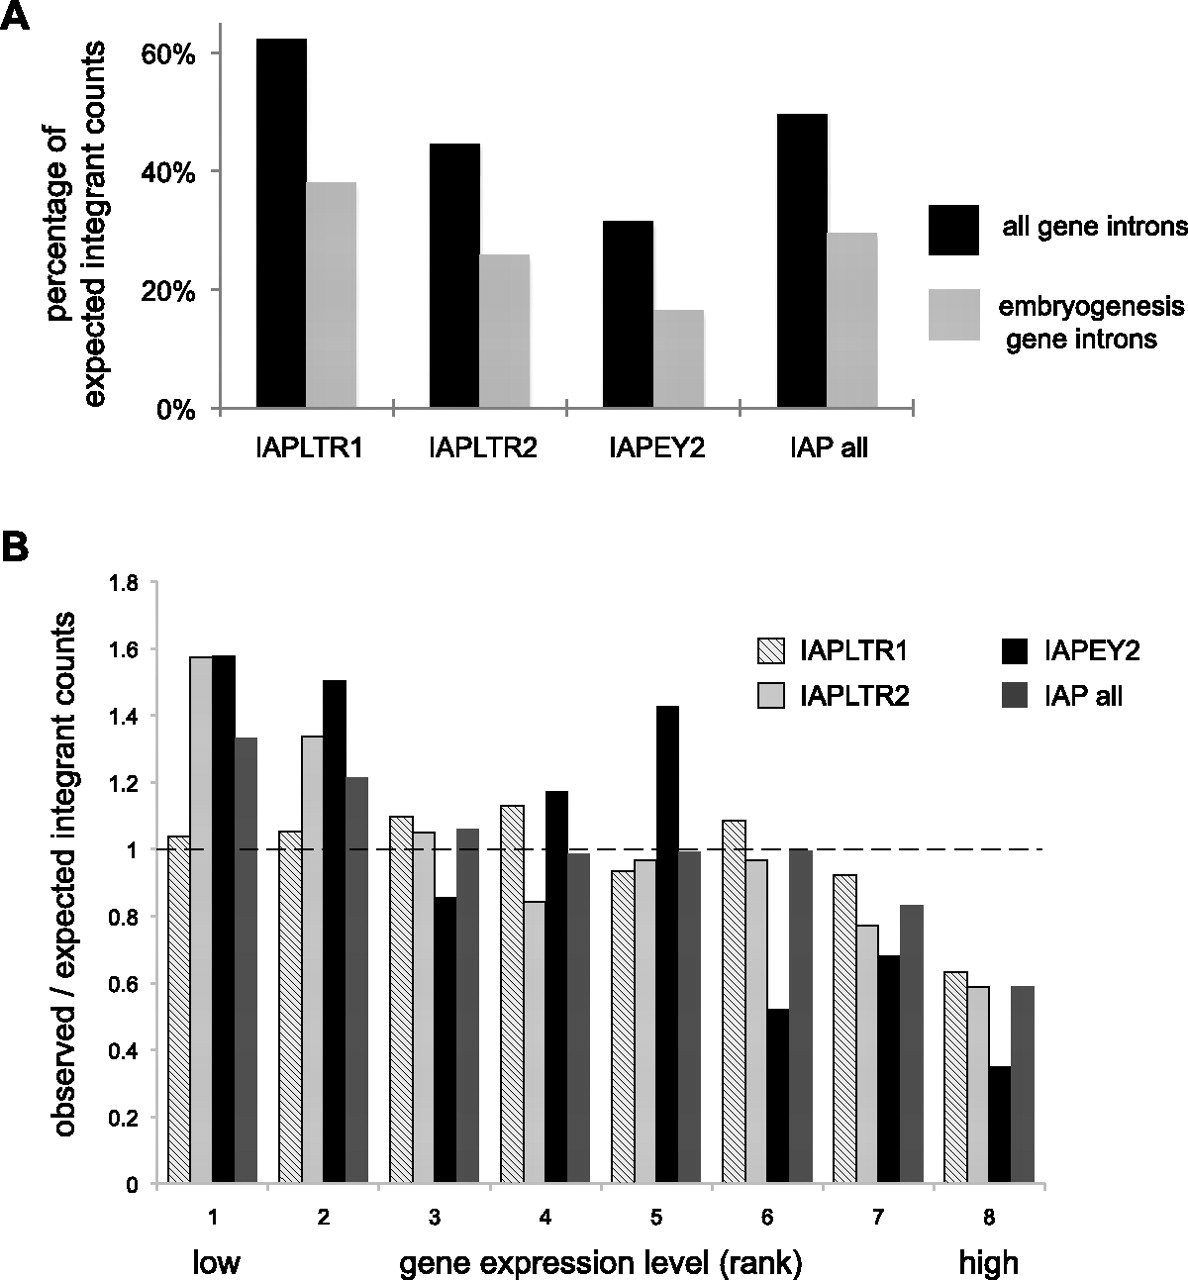
Young ERVs are excluded from introns, particularly from embryogenesis and highly expressed genes. (A) “Observed” ERV integrant counts are plotted as percentages of “expected” counts within all gene introns (black histograms) or embryogenesis genes (gray). Genomic locations of various classes of ERVs (x-axis) were identified in diverse mouse lineages. Expected counts were determined by random simulation of 2 million insertion sites across the reference genome. By chance, ∼35% of ERV insertions would be expected to fall within RefSeq gene introns, and ∼2.7% of all insertions would fall within embryogenesis genes, defined by the Mouse Genome Informatics database (http://www.informatics.jax.org). This normalization corrects for gene lengths. Percentages <100% signify relative exclusion of certain ERV subtypes from particular gene categories. (B) Based on their expression levels in mouse ES cells measured by microarrays (Mikkelsen et al. 2007), genes were binned into eight groups ranked from 1 (lowest expression) to 8 (highest), each with roughly equivalent numbers of genes expressed at comparable levels. Ratios of the observed numbers of genes containing intronic ERV integrants versus the expected number of genes identified by random simulation are presented (Brady et al. 2009) for different classes of ERV integrants (key, upper right). (Dashed line) Ratio = 1 signifies equivalence between observed and expected counts; ratios < 1 signify relative exclusion of ERV integrants from particular groups of genes.


