
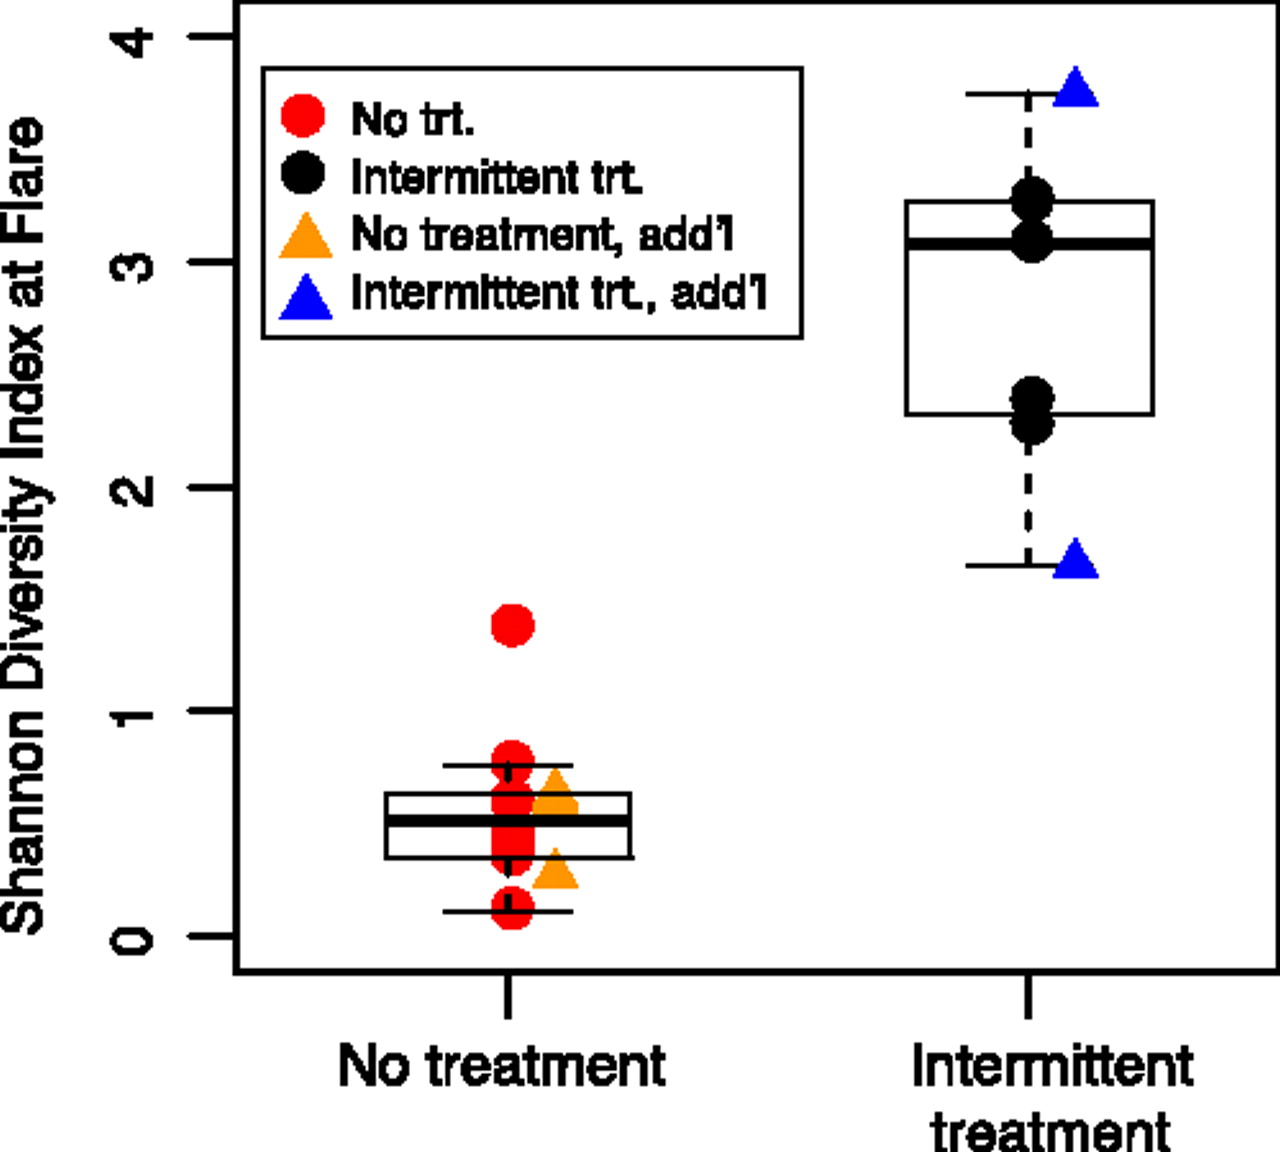
Figure 5.
Shannon diversity index during flares. Circles indicate AD patients with a full longitudinal cycle (baseline, flare, and postflare). Triangles indicate flares from four additional (add'l) patients. Means between no-treatment (trt) and intermittent-trt tested with Wilcoxon rank-sum test (P < 0.0025, n = 16).


