
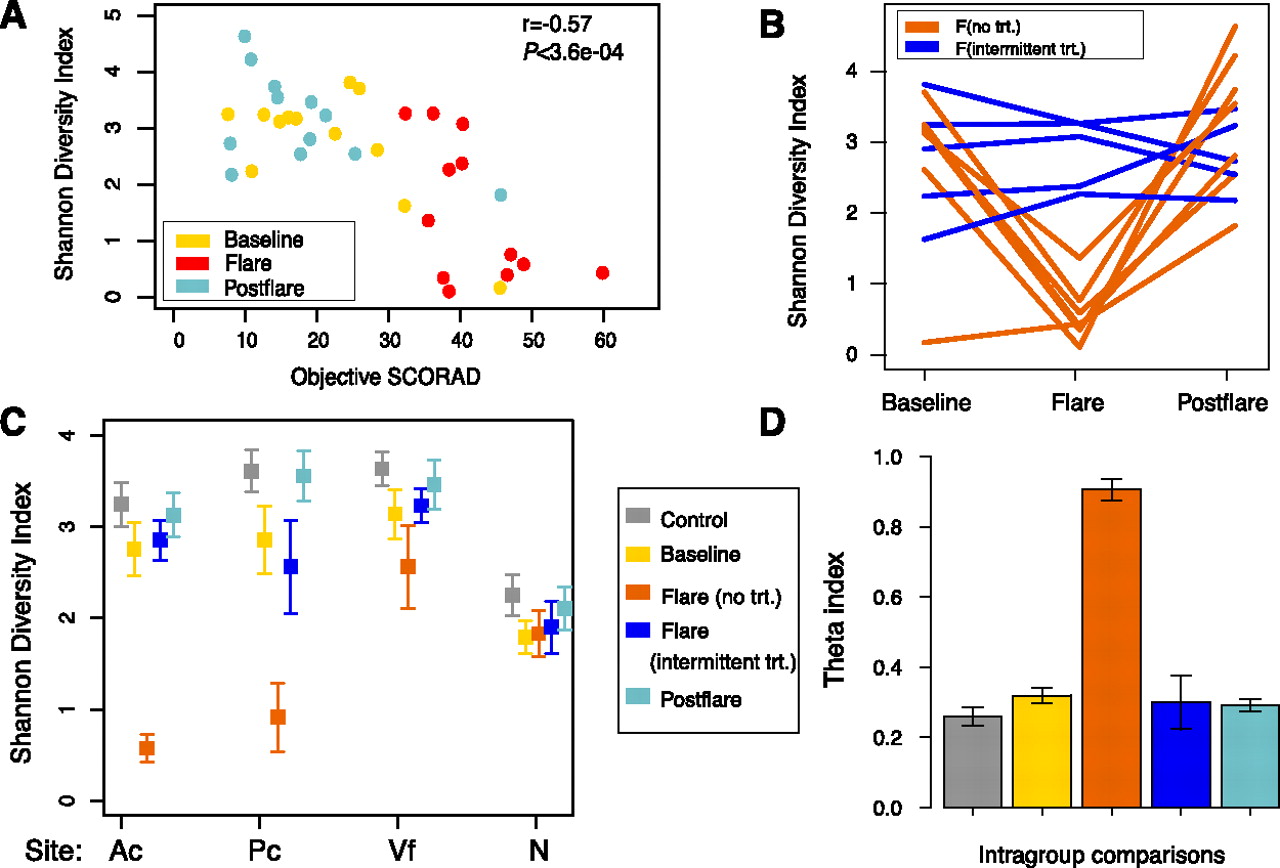
Microbial community-level statistics in the AD microbiome. (A) Relationship between objective SCORAD and Shannon diversity in the Ac of AD patients. Partial correlation (adjusting for disease state). (B) Longitudinal Shannon diversity trend in AD grouped by no-treatment (trt) and intermittent-trt flares (n = 12, Ac). (C) Mean Shannon diversity ± SEM in controls and all AD disease states (Ac, Pc, volar forearm [Vf], nares [N]). (D) Mean theta (θ) similarity coefficients ± SEM. Pairwise comparisons of community structure between individuals within a control or AD disease group. Bars represent average of all pairwise comparisons of community structure for control individuals to other controls, baselines to baselines, flares(no-trt)-flares(no-trt), flare(intermittent-trt)-flare(intermittent-trt), and postflares-postflares.


