
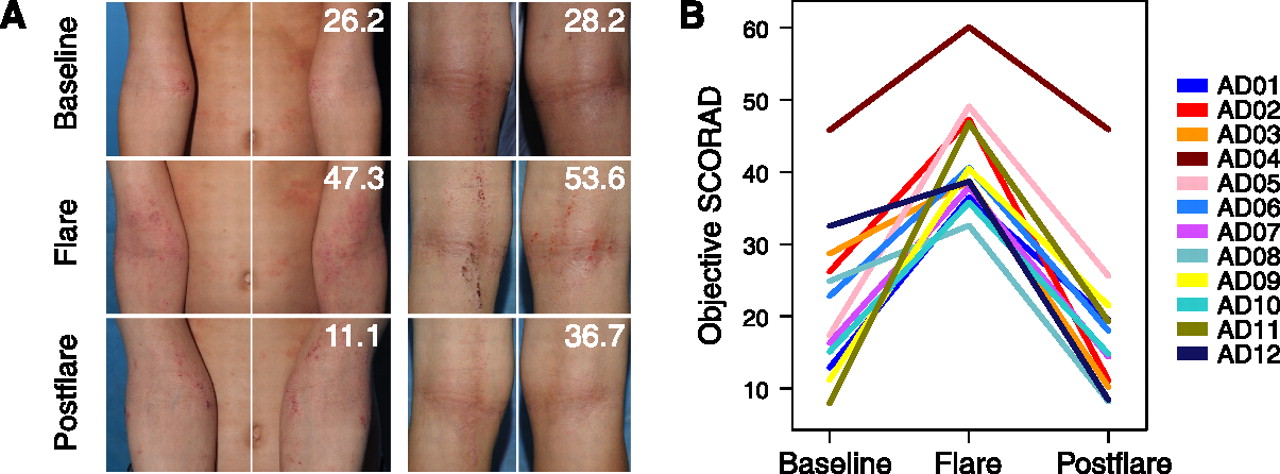
Figure 1.
AD disease severity. (A) Representative clinical images of the antecubital (Ac, left) and popliteal creases (Pc, right) in two patients with overall disease severity scores (objective SCORAD). (B) Longitudinal objective SCORAD trend for each patient (n = 12) at baseline, flare, and postflare.


