
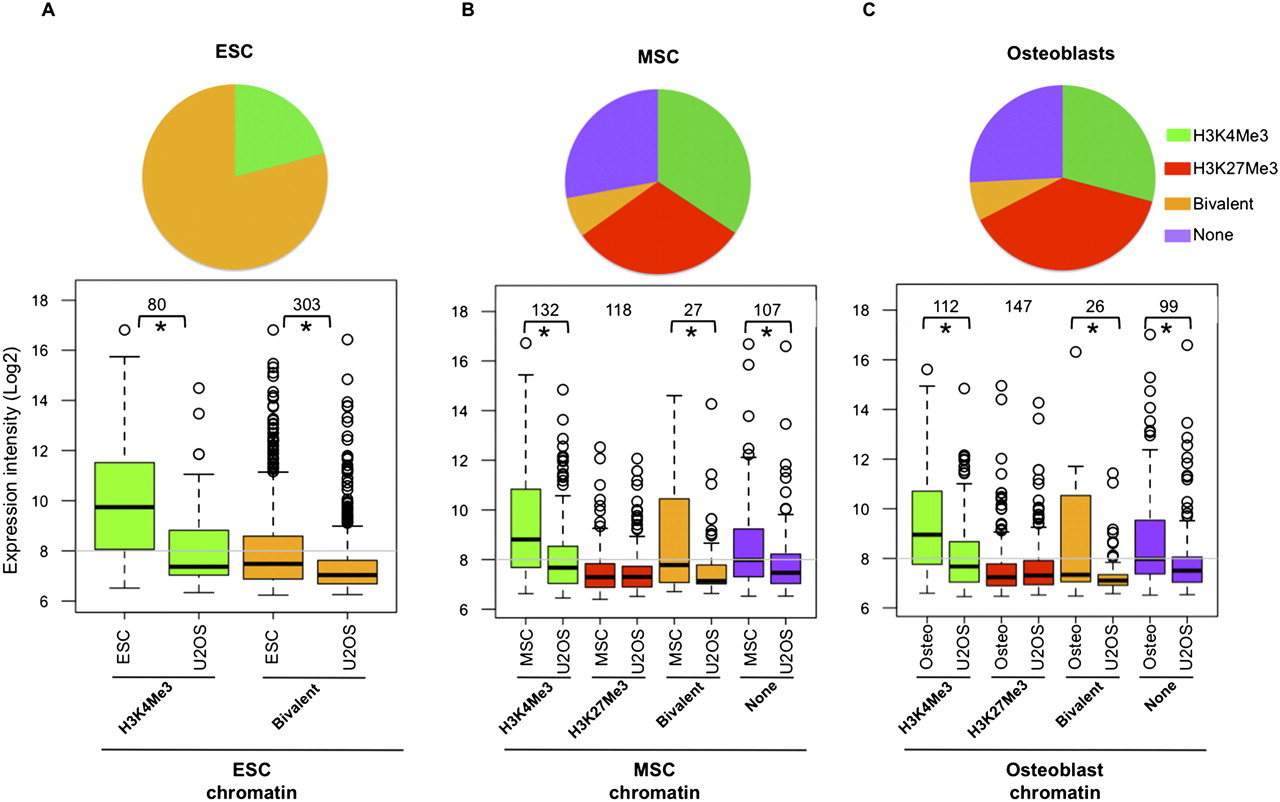
Figure 3.
Enrichment of chromatin marks and levels of gene expression in ESCs, MSCs, and osteoblasts for genes methylated in U2OS. (Pie chart) Proportion of genes methylated in U2OS that have the different chromatin marks or none of the marks analyzed in this study in ESCs (A), MSCs (B), or osteoblasts (C). (Lower panels) Array expression intensities (log2) in ESCs, MSCs, or osteoblasts of gene probes constituting these subsets; in each case, they are compared to that in U2OS. (*) Significant gene expression changes (P-value < 0.005). (Gray line in the plot) Median log2 intensity of all genes in the corresponding cell type. See also Supplemental Figures 1 and 3.


