
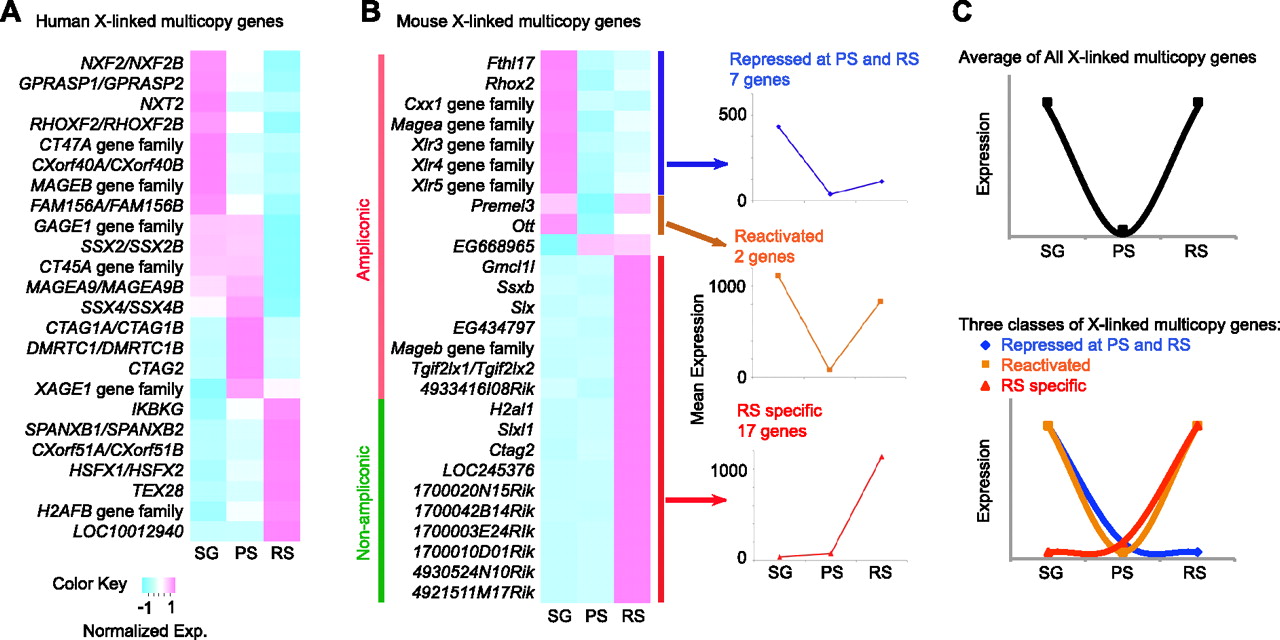
Expression profiles of X-linked multicopy genes. (A) Expression heat map of human X-linked multicopy genes in this study (see Methods) (Chalmel et al. 2007; Wu et al. 2009). (B) Expression heatmap of mouse X-linked multicopy genes. Published microarray data were reanalyzed (Namekawa et al. 2006). SG in mice data sets represents the average expression levels between spermatogonia A and B. Mean expression patterns are shown in right panels. A previous study proposed that most multicopy X-linked genes are repressed by MSCI and reactivated in RS in mice (Mueller et al. 2008). However, we found that mouse multicopy X-linked genes are mainly classified into two major groups. The first group is repressed by MSCI, and these genes also stay repressed in RS (repressed at PS and RS); the other group is expressed in an RS-specific manner, and these genes are already silent in the mitotic cells, regardless of MSCI (RS-specific). We found that only two genes (Plemel3 and Ott in panel B) showed repression by MSCI and reactivation in RS in mice. (C) Of note, when we calculate the average expression of the two major groups, “Repressed at PS and RS” and “RS-specific,” our data mirror the expression pattern from the previous study (Mueller et al. 2008).


