
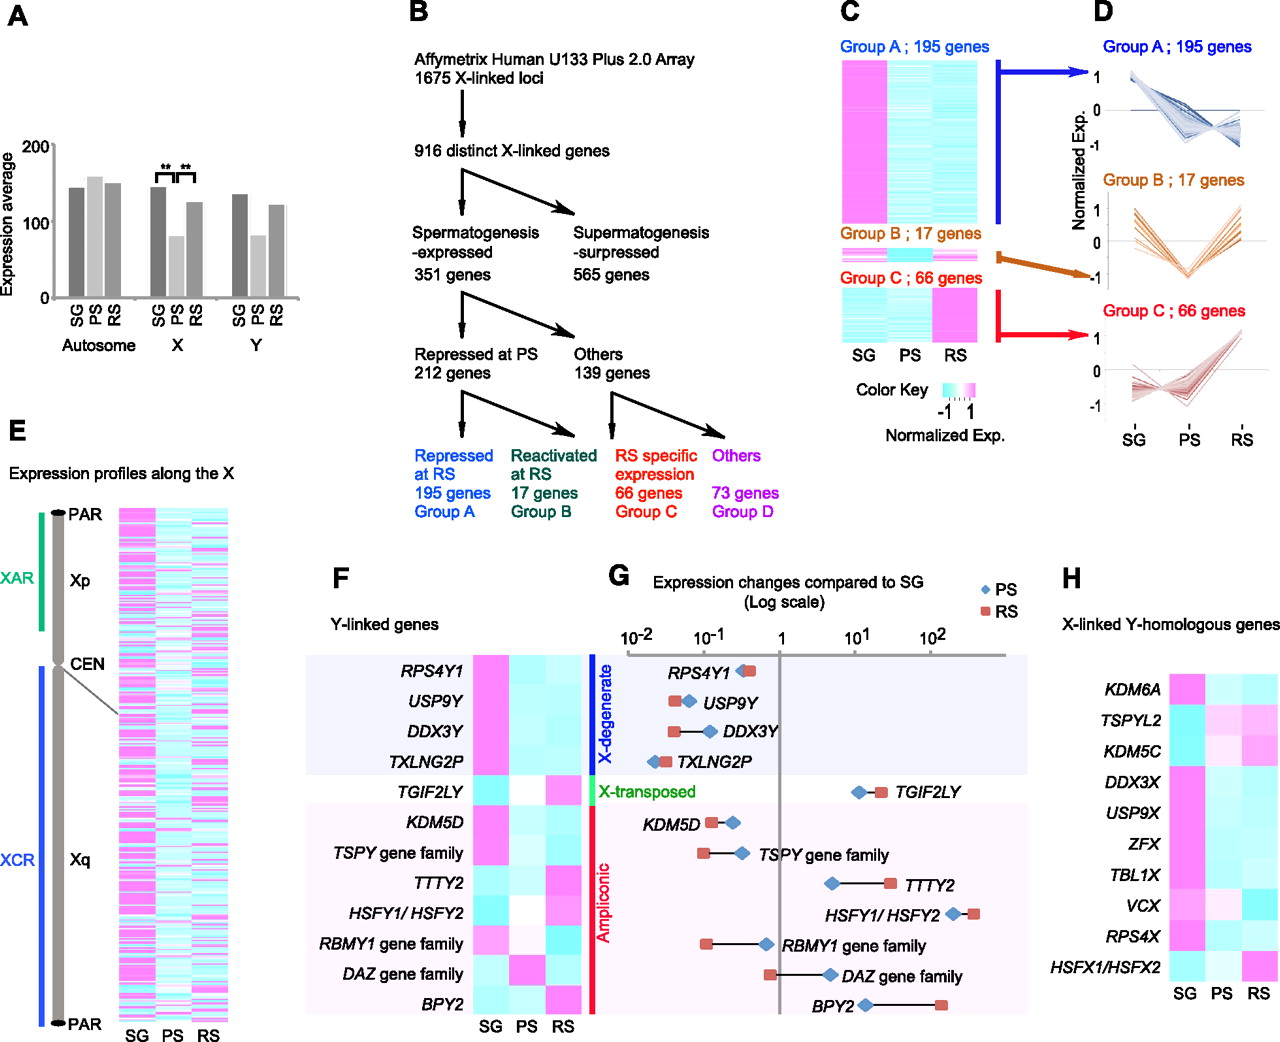
Figure 3.
Microarray analysis of human MSCI and postmeiotic silencing. (A) Expression average of spermatogonia (SG), pachytene spermatocytes (PS), and round spermatids (RS). (**) p < 10−4, Tukey's multiple comparison test. (B) Classification of X-linked genes based on the expression profiles. (C) Expression heatmaps of normalized gene expression profiles for each group. (D) Normalized expression patterns of each group. (E) Expression heatmap along the location of the X chromosome. (F) Expression heatmap of Y-linked genes; genomic features are indicated. (G) Expression changes of Y-linked genes compared with SG. (H) Expression heatmap of X-linked Y-homologous genes.


