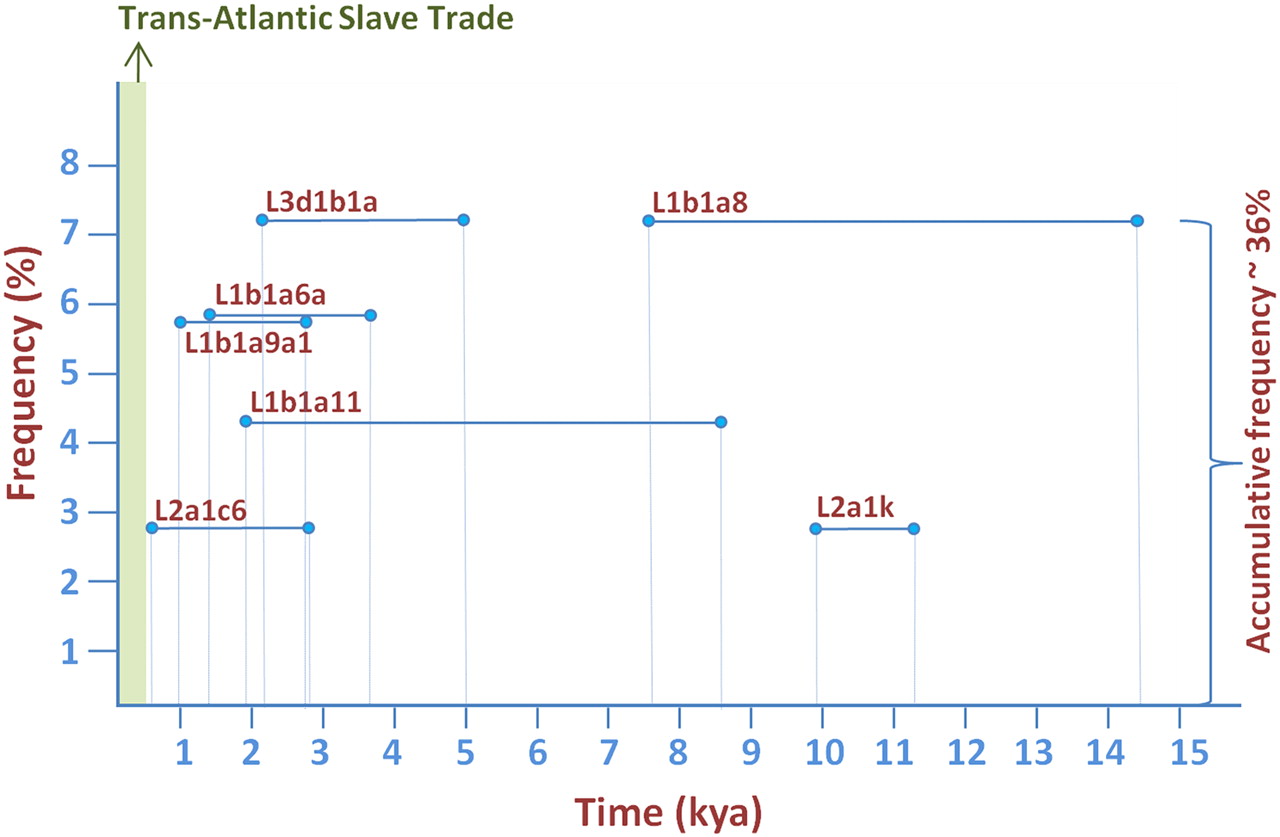
Reconstructing ancient mitochondrial DNA links between Africa and Europe

(Downloading may take up to 30 seconds. If the slide opens in your browser, select File -> Save As to save it.)

Click on image to view larger version.

Figure 5.
Figure 5.

Diagram showing the coalescence ages of L-European lineages and their 95% C.I. (see also Supplemental Table S2) and the estimated frequencies in Europe over the total number of existing L mitochondrial genomes from Europe.

This Article

  1. Genome Res. 22: 821-826

Preprint Server