
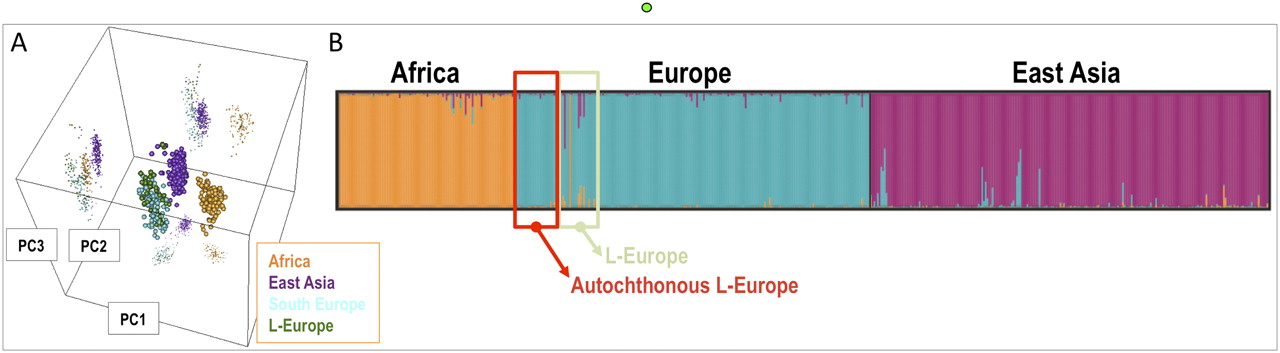
Figure 4.
(A) 3D principal component analysis performed on samples analyzed in the present study (L-European carriers), Africans (n = 102; CEPH panel), East Asians (n = 229; CEPH panel), and South Europeans (n = 160; data set from Spain and Italy taken from SNPforID (Sánchez et al. 2006; Phillips et al. 2007), all genotyped for a panel of 34 AIMs. The genotyping data were compiled using SPSmart (Amigo et al. 2008). (B) Structure bar plot indicating ancestral components of L-European mtDNA carriers based on profiles derived from a set of 34 AIMs.


