
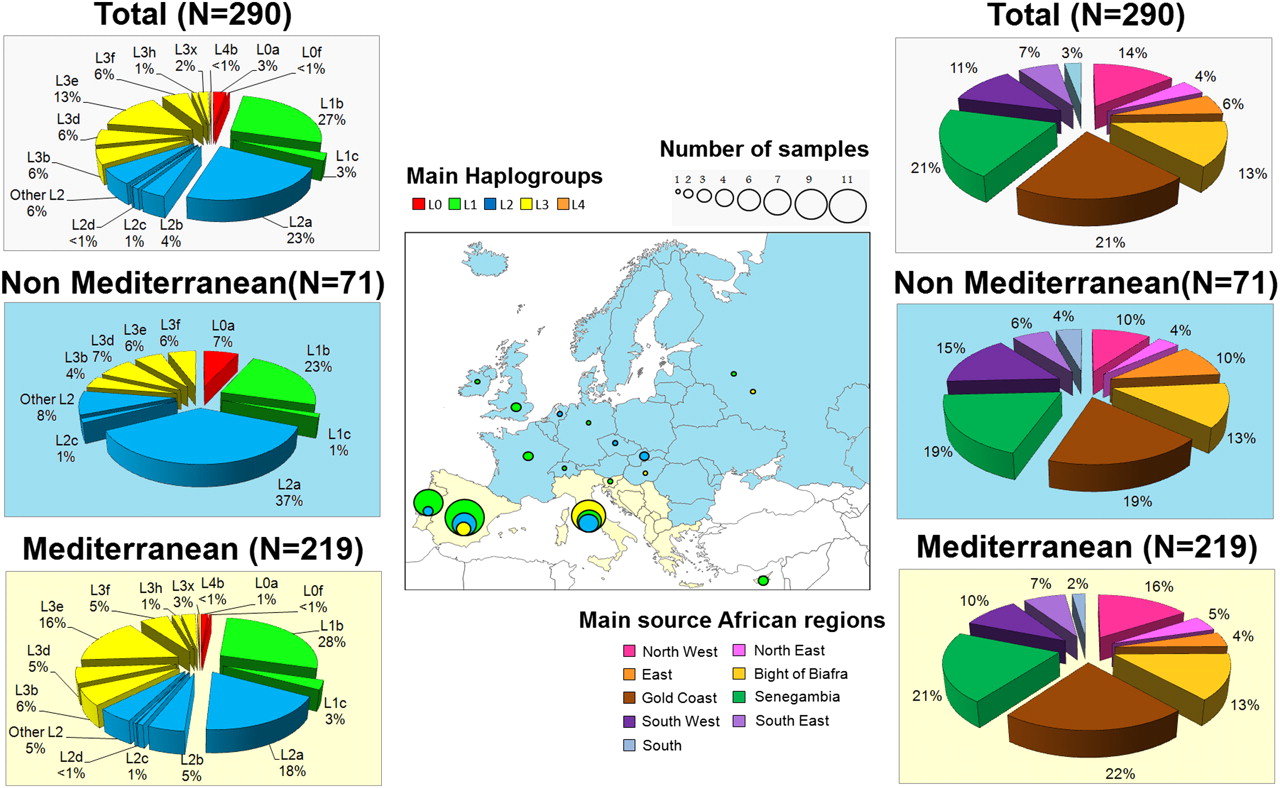
Figure 3.
The pie charts on the left indicate the frequency distribution of African haplogroups in Europe; the color circles within the map indicate the distribution of entire genomes in Europe clustered in main haplogroups. The pie charts on the right show the admixture components of L-European lineages in Africa.


