
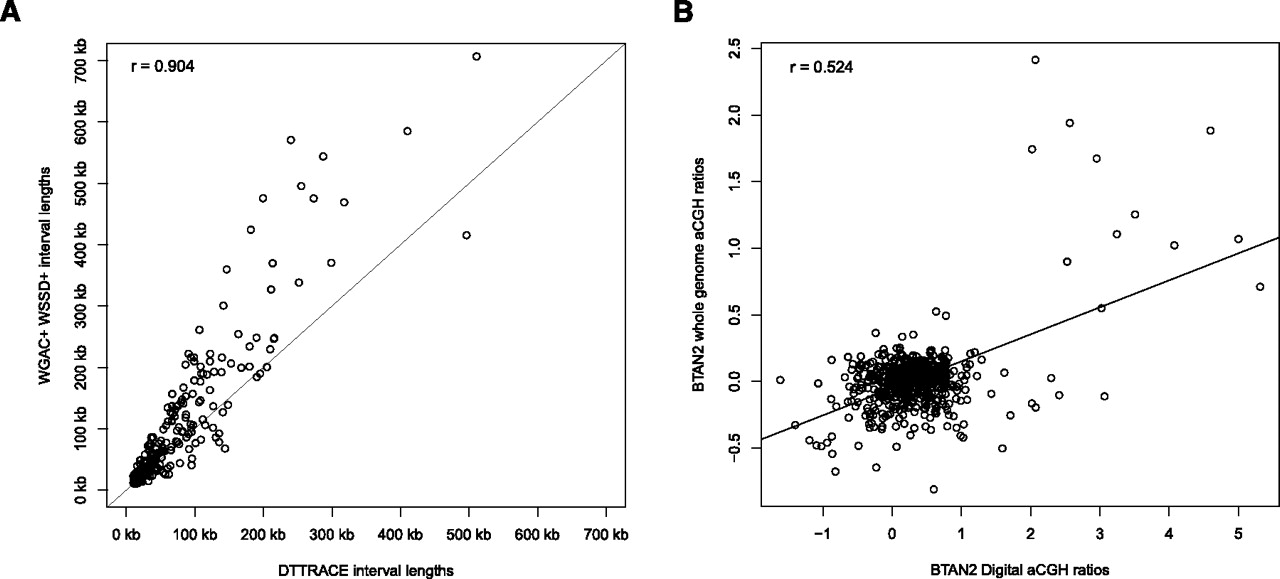
Figure 2.
Correlation between computational predictions and experimental validations. (A) A good agreement of lengths (r = 0.904) exists between previously discovered WSSD+, WGAC+, and predicted DTTRACE duplications. (B) Calculated digital aCGH probe values (BTAN2_ngs) were compared with probe log2 ratios from a whole-genome aCGH (BTAN2_whole). Digital aCGH values were estimated using a log2 ratio of the 1-kbp CN windows from BTAN2 divided by CN estimates from DTTRACE. A moderate correlation (r = 0.524) was found for aCGH probe values and digital aCGH values within CNV intervals >20 kbp that had fewer than 80% of their lengths occupied by common repeats.


