
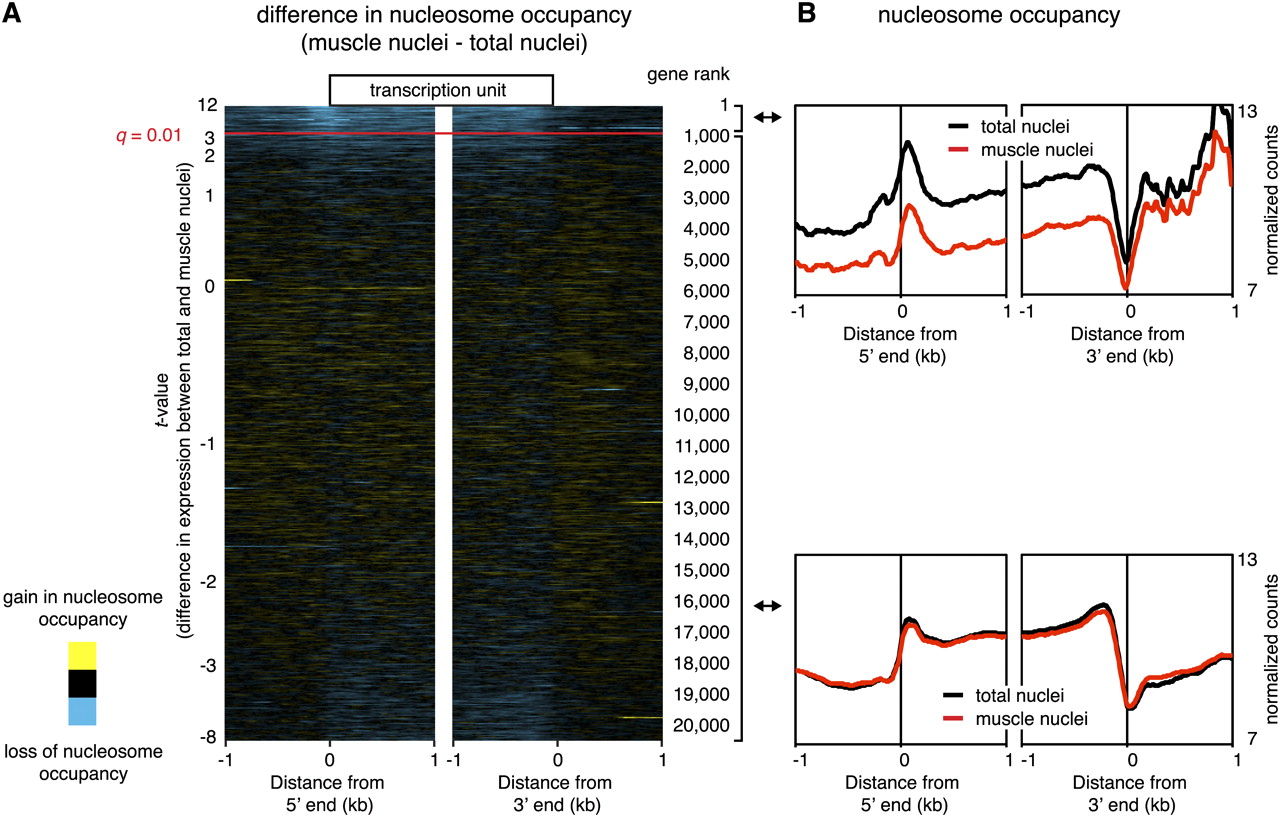
(A) Heat map showing differences in nucleosome occupancy at promoters and over gene bodies between total nuclei and muscle nuclei from C. elegans. Chromatin of total nuclei and affinity-purified muscle nuclei was digested to mostly mononucleosomes by MNase. Nucleosome-protected fragments were paired-end-sequenced, and the difference between normalized counts from purified nuclei and total nuclei was calculated. Genes were aligned at the 5′ end and at the 3′ end and ranked from highest to lowest difference in expression between purified nuclei and total nuclei. Yellow represents higher and blue lower nucleosome occupancy in muscle nuclei. The red line marks the q-value of 0.01. (B) Average nucleosome occupancy around the 5′ and 3′ ends for muscle-enriched genes (q < 0.01; upper panel) and non-muscle-enriched genes (lower panel). Profiles are shown for samples from total nuclei (black) and affinity-purified nuclei (red).


