
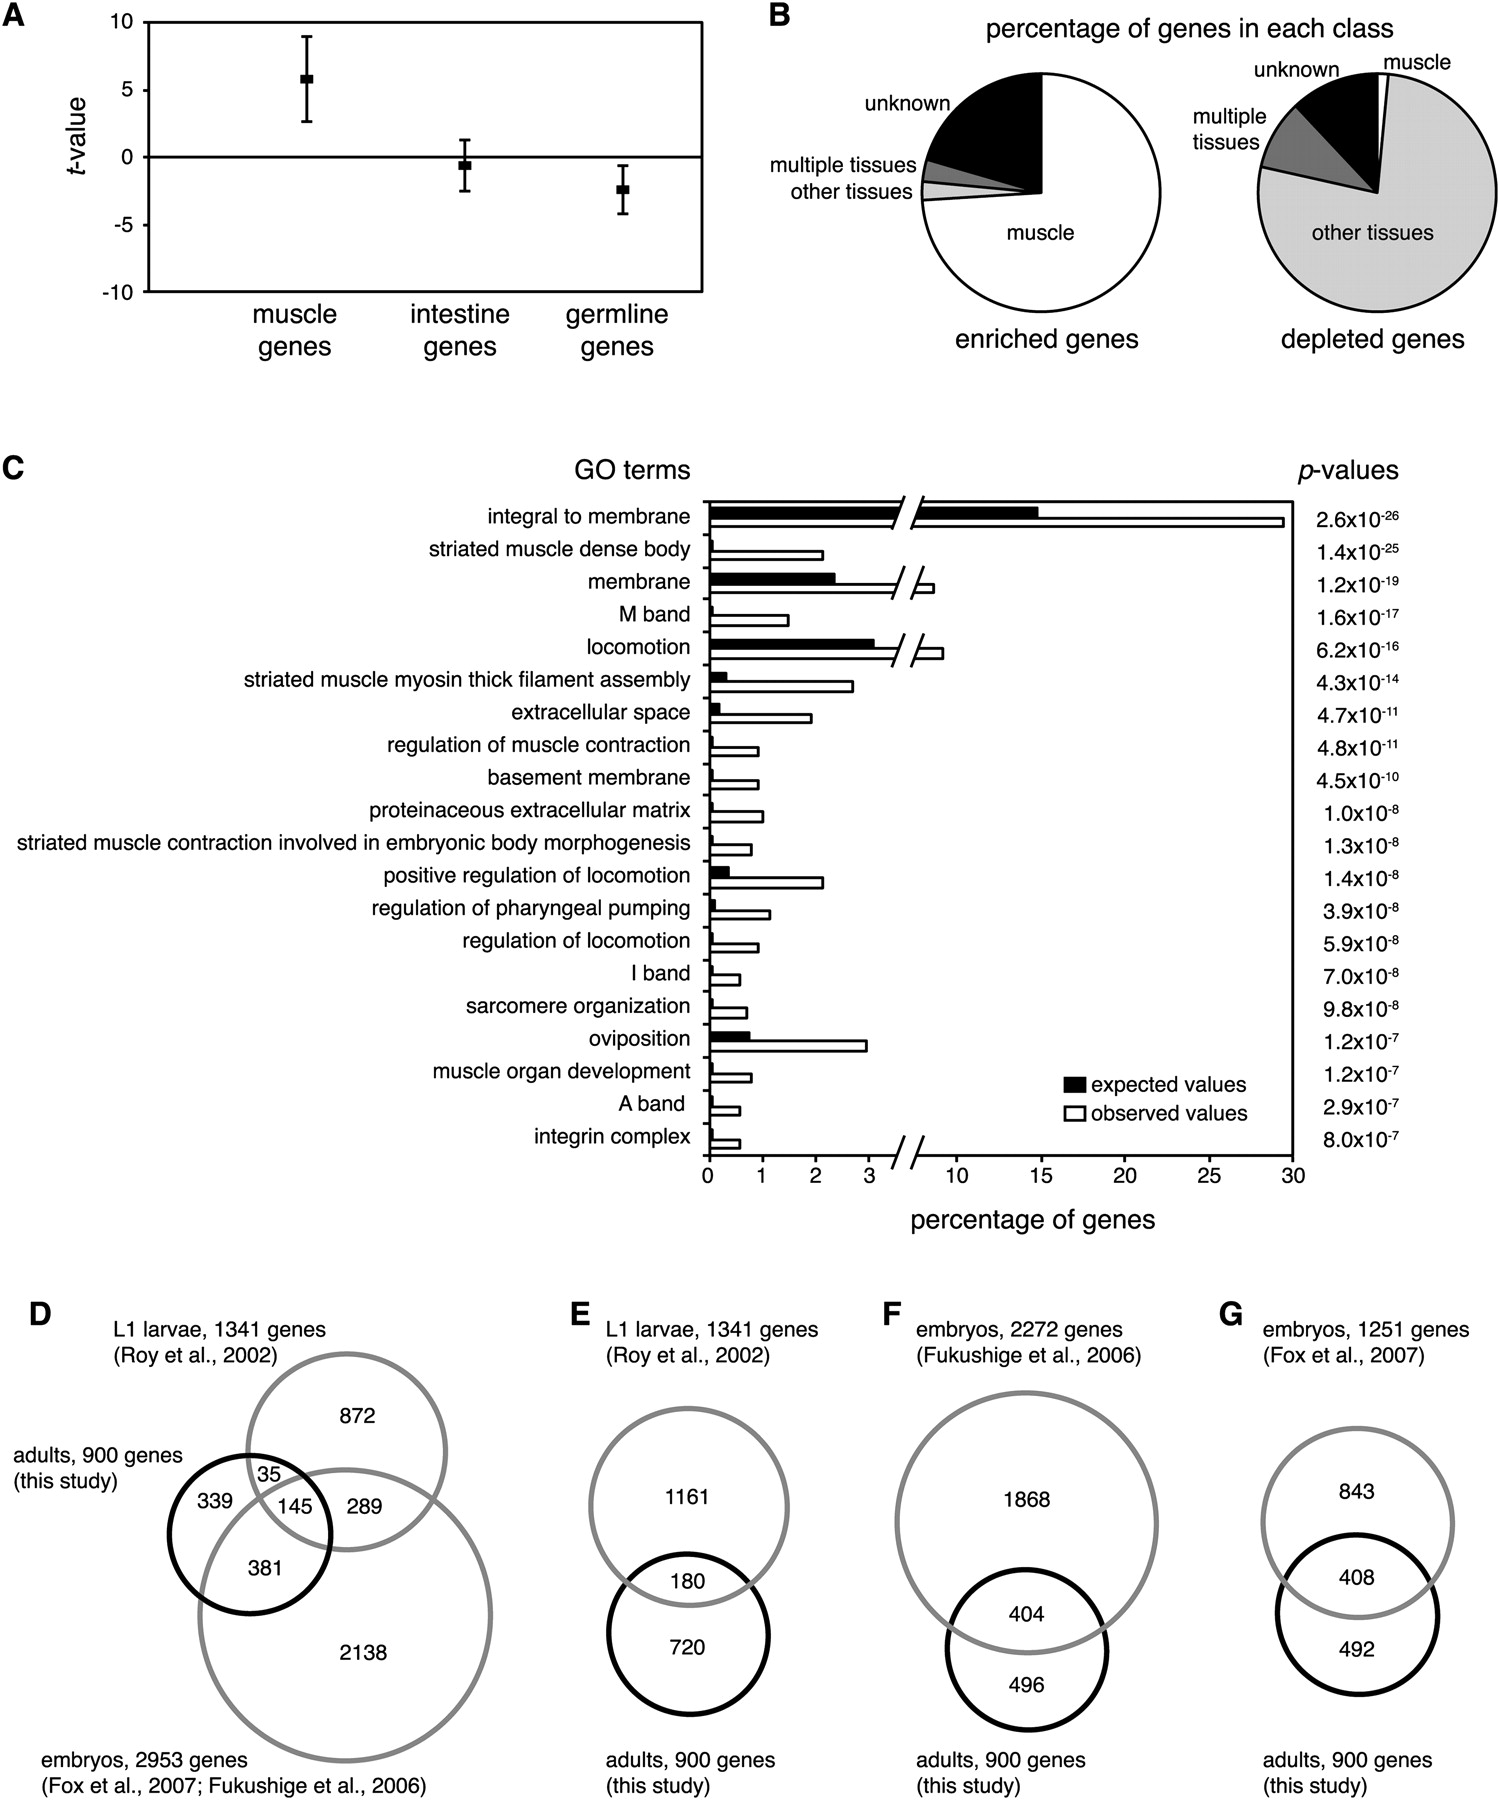
Expression profiling of affinity-purified C. elegans muscle nuclei. RNA from four independent nuclei purifications was analyzed using high-density tiling arrays. Bayesian t-values were determined using Cyber-T. (A) Enrichment or depletion of genes specific for muscle (components of the sarcomere, 50 genes), intestine (enterocyte, 76 genes), and germline (45 genes). Averages and standard deviations of t-values are shown. (B) Classification of the 200 most enriched and most depleted genes based on WormBase annotations. Genes were grouped as exclusively or predominantly expressed in muscle or muscle-enriched (white), expressed or enriched in non-muscle tissues (light gray), expressed or enriched in multiple tissues including muscle (dark gray), or without expression annotation (black). (C) Top 20 most significant Gene Ontology annotations of the significantly enriched genes found in this study (q < 0.01). Observed (white) and expected (black) percentages of genes and corrected hypergeometric P-values are shown. (D) Overlap of our set of 900 significantly enriched genes described in this study with genes previously found to be muscle-enriched in embryos and L1 larvae (Roy et al. 2002; Fukushige et al. 2006; Fox et al. 2007). (E–G) Overlap of our set of muscle-enriched genes with genes previously found to be muscle-enriched as in D, but shown separately for each study.


