
Figure 5.
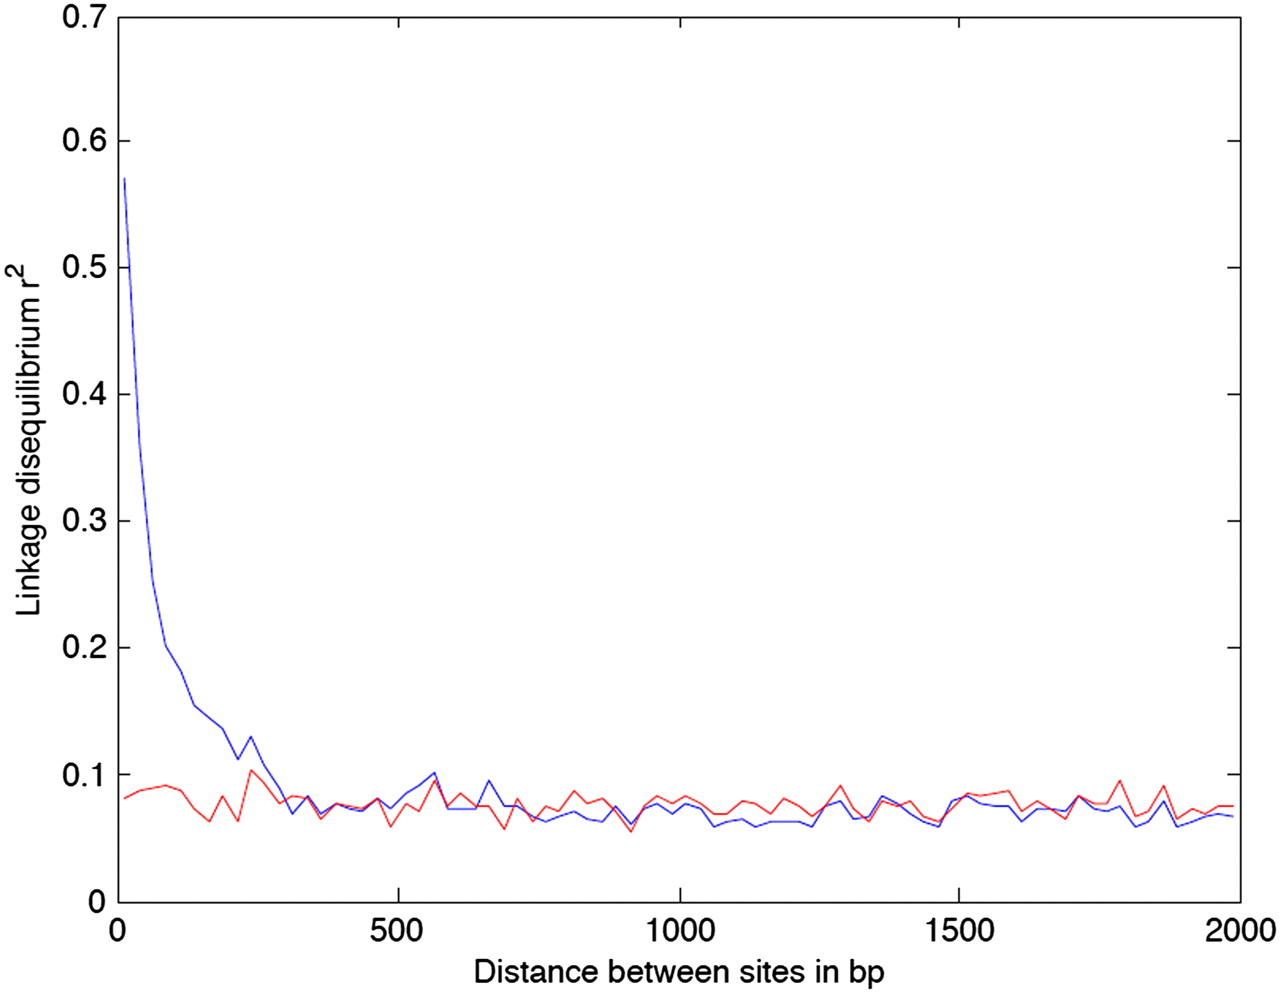
Relationship between linkage disequilibrium (y-axis) and genomic distance between pairs of SNPs (x-axis). (Blue line) LD computed using all SNPs; (red line) LD after excluding SNPs identified in recombination tracts.
(Downloading may take up to 30 seconds. If the slide opens in your browser, select File -> Save As to save it.)
Click on image to view larger version.
Relationship between linkage disequilibrium (y-axis) and genomic distance between pairs of SNPs (x-axis). (Blue line) LD computed using all SNPs; (red line) LD after excluding SNPs identified in recombination tracts.
 CiteULike
 Delicious
 Digg
Digg Facebook
 Google+
 Reddit
 Twitter
