
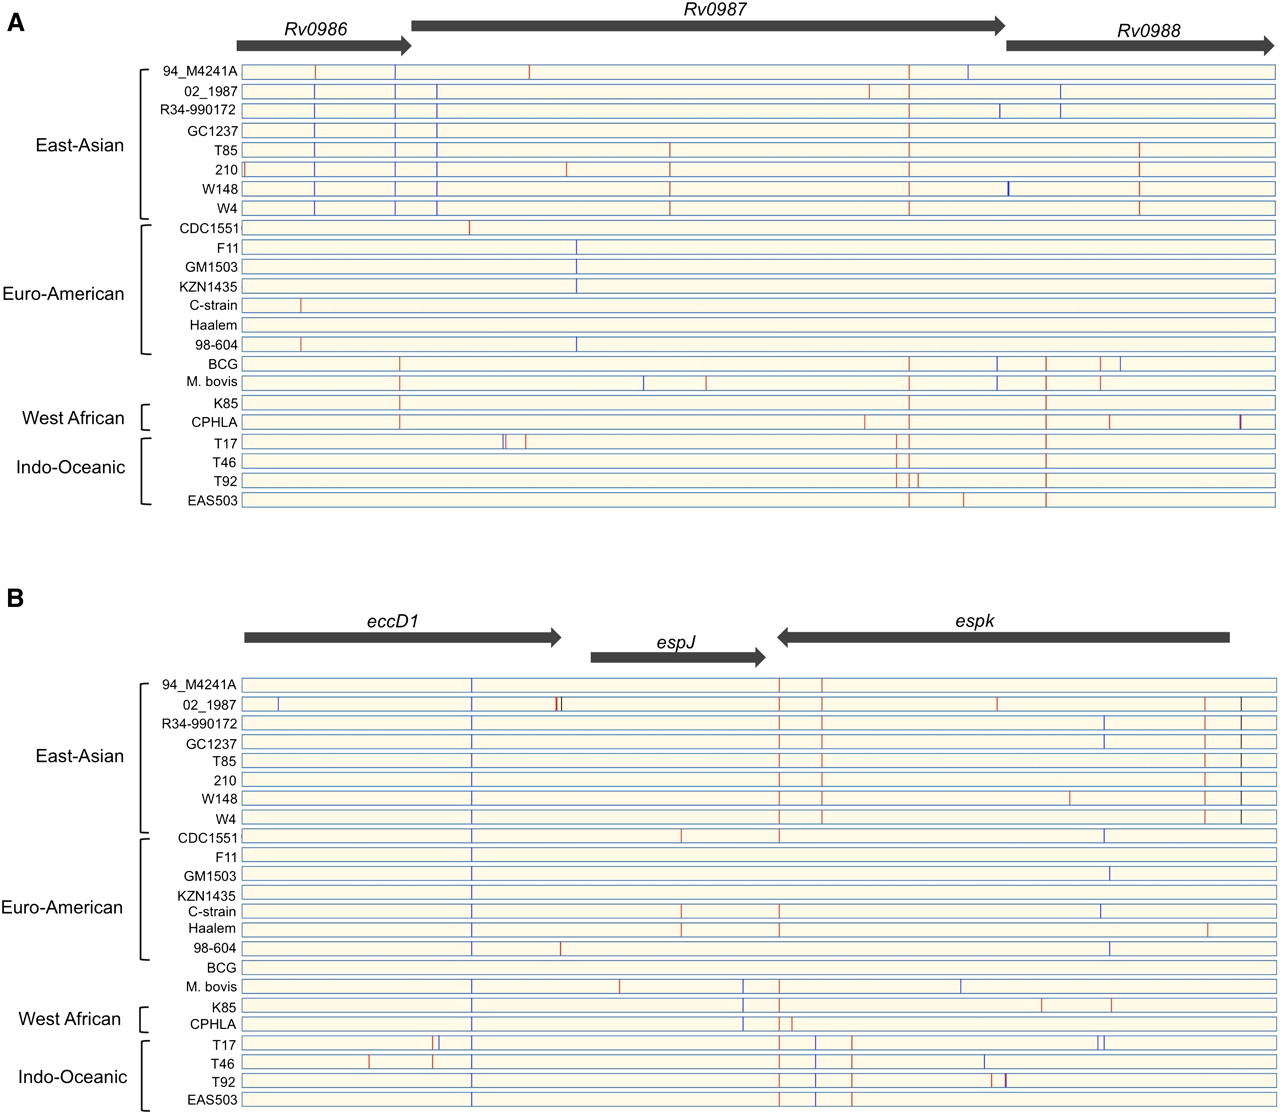
Figure 3.
Graphical representation of the distribution of SNPs in two regions of SNPs clustering. (A) Virulence operon horizontally transferred to the ancestor of M. tuberculosis. (B) Genomic region part of the ESX-1 locus. Synonymous (blue lines) and non-synonymous (red lines) SNPs were identified according to the genome of the reference strain H37Rv. (Black lines) SNPs identified in intergenic regions.


