
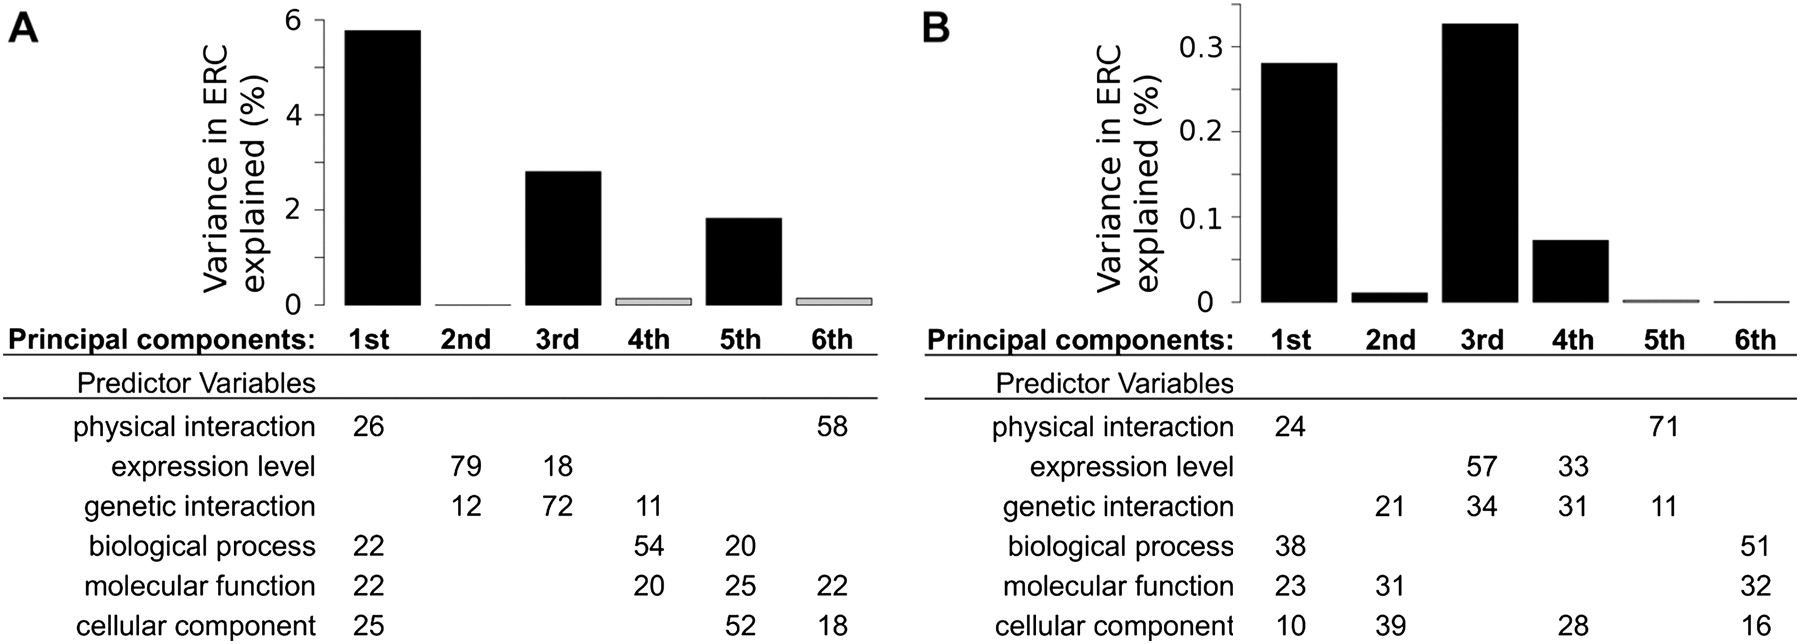
Multivariate analysis reveals biological variables associated with ERC. Two principal components regressions were performed: one on nuclear pore and DNA repair proteins (A) and the second on a larger 982-protein data set (B). The predictor variables (rows) were broken into six principal components (columns). Table values are the percentage of each predictor variable composing a principal component. For visual clarity, values <10% are not displayed. Each component was regressed against ERC to determine its individual contribution, and the bar above a component shows the percent of ERC variance explained. Components significantly associated with ERC have black bars (P < 0.01).


