
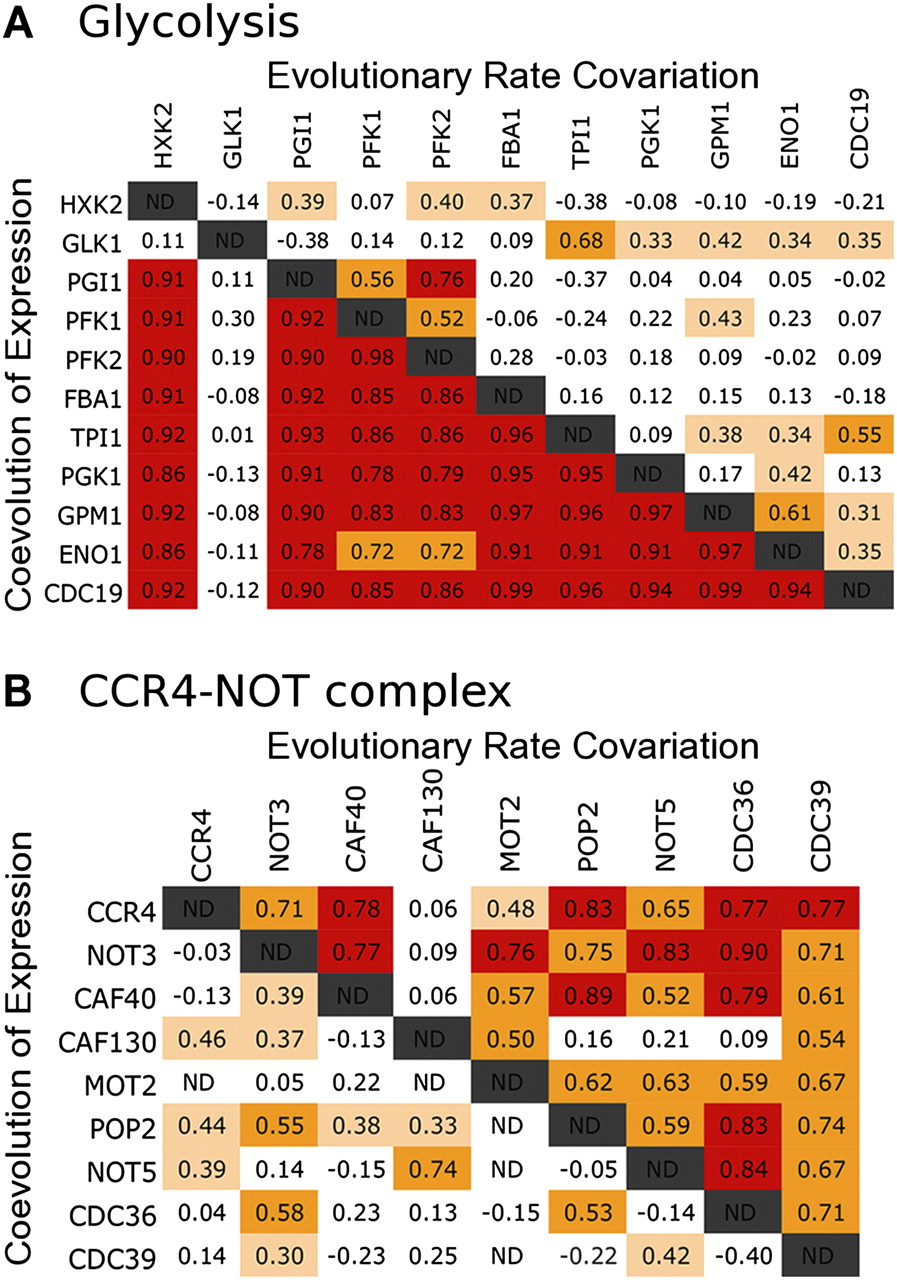
Figure 4.
ERC and coevolution of expression are not coincidental. Pairwise correlation matrices show values of ERC (above diagonal) and coevolution of expression level (below diagonal) between glycolysis (A) and CCR4-NOT complex (B) proteins. Both ERC and expression coevolution are significantly elevated for both sets of proteins (P < 0.01). However, ERC is much stronger than expression coevolution in the CCR4-NOT complex, while it is the opposite case between glycolysis proteins. (Red) Values greater than 0.75; (orange) values between 0.5 and 0.75; (beige) values between 0.3 and 0.5.


