
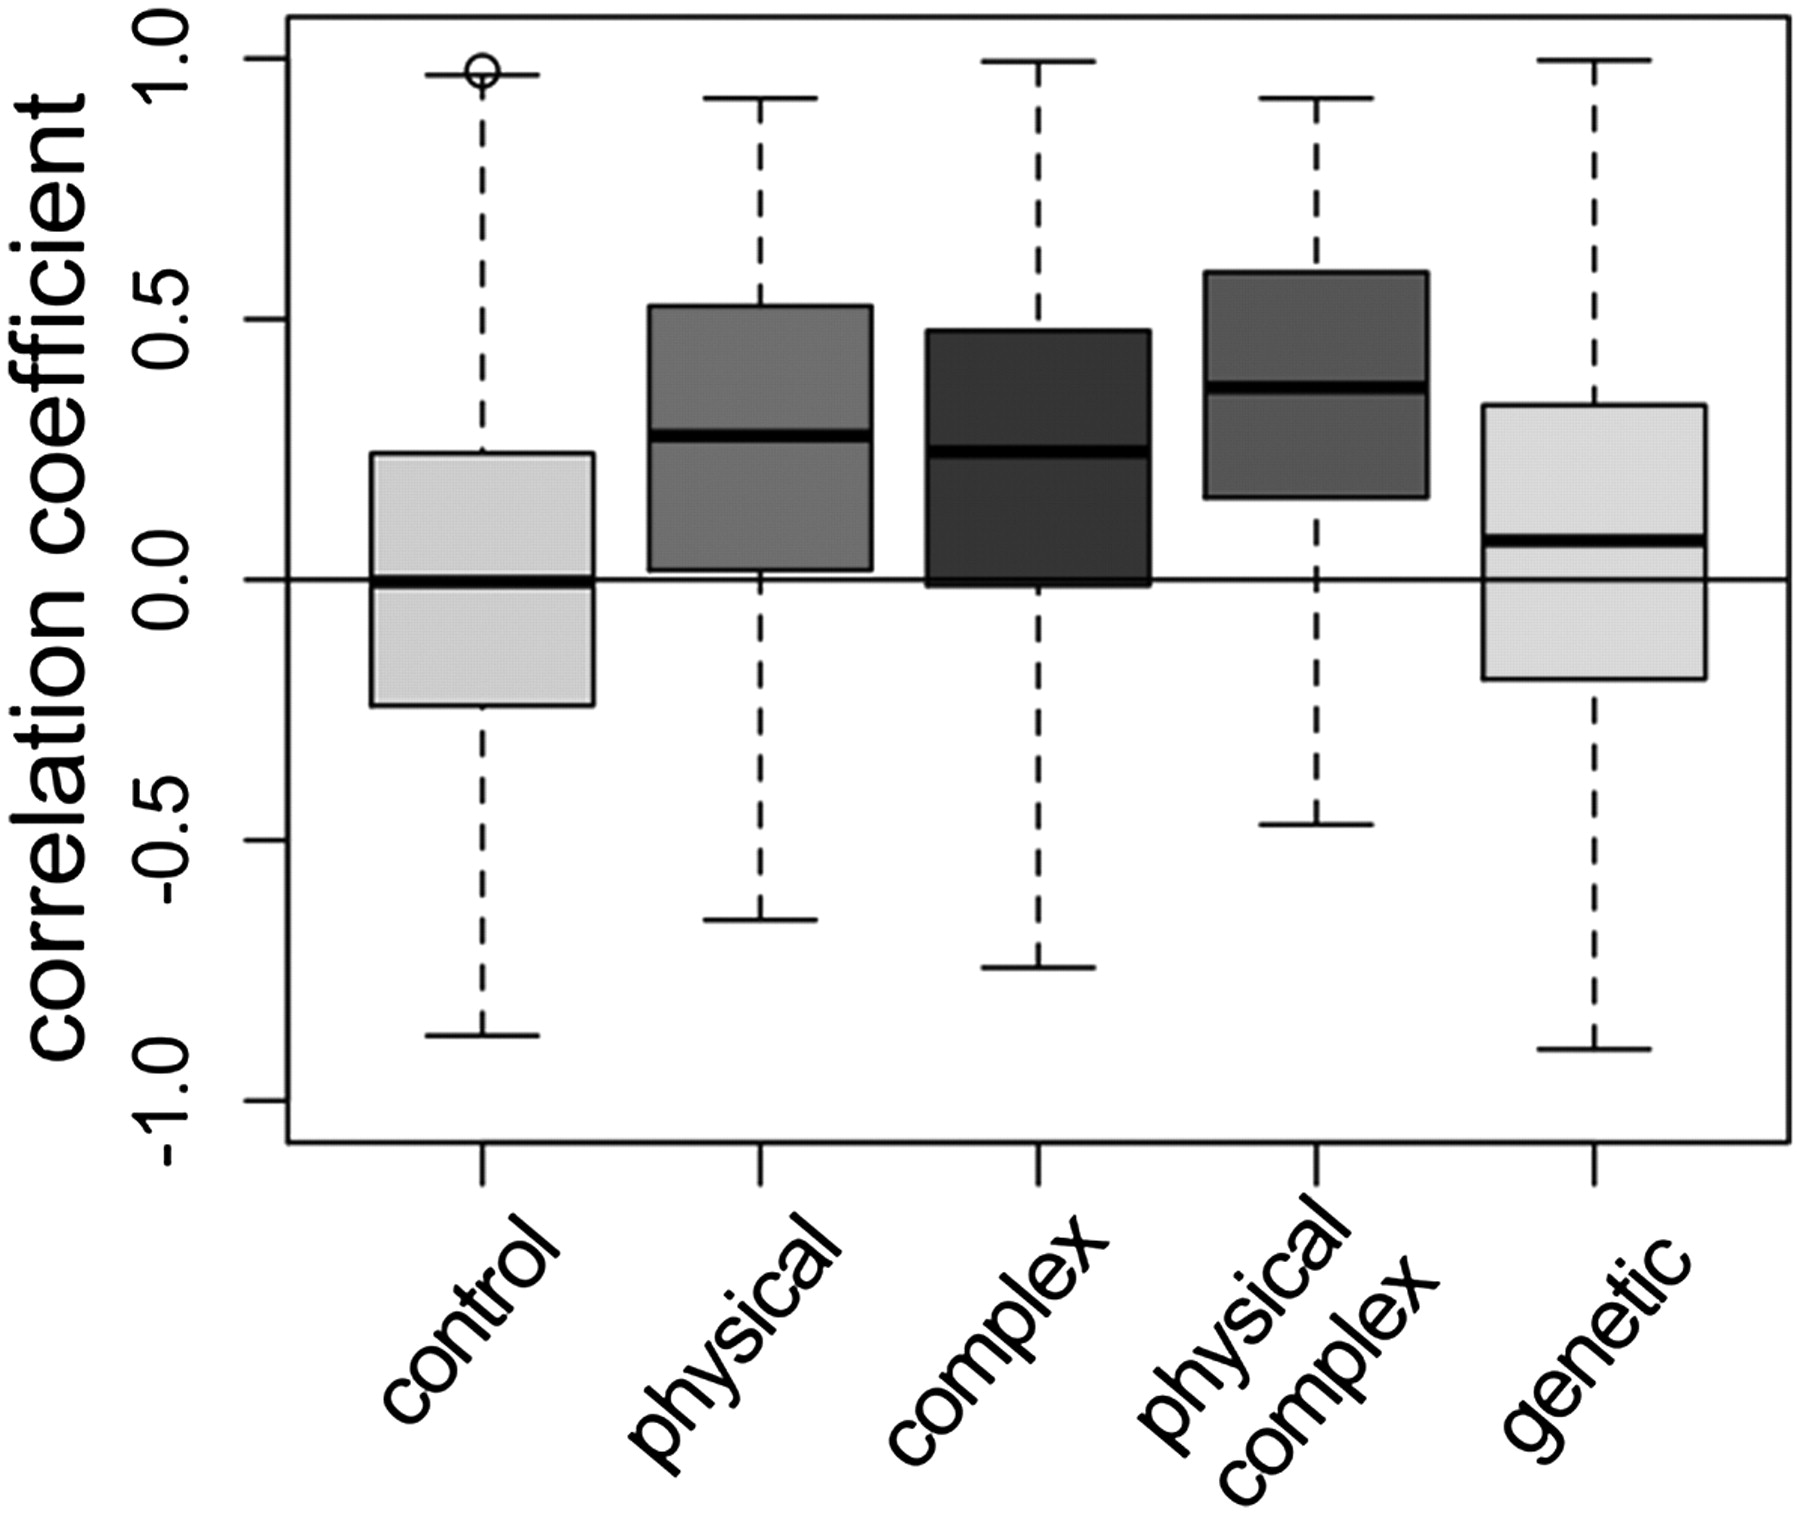
Figure 2.
ERC is elevated between functionally related proteins. Here, we contrast ERC between protein pairs that: (left to right) have no annotated relationship (control), physically interact, are in the same complex, physically interact and are in the same complex, and genetically interact. All classes are significantly different from the control class (Wilcoxon rank sum test, P < 2.2 × 10⁻¹⁶). The box limits are the upper and lower quartiles of each distribution, while the bold line represents the median. Whiskers extend to the most extreme data point outside the box that is no more than 1.5 times the interquartile range.


