
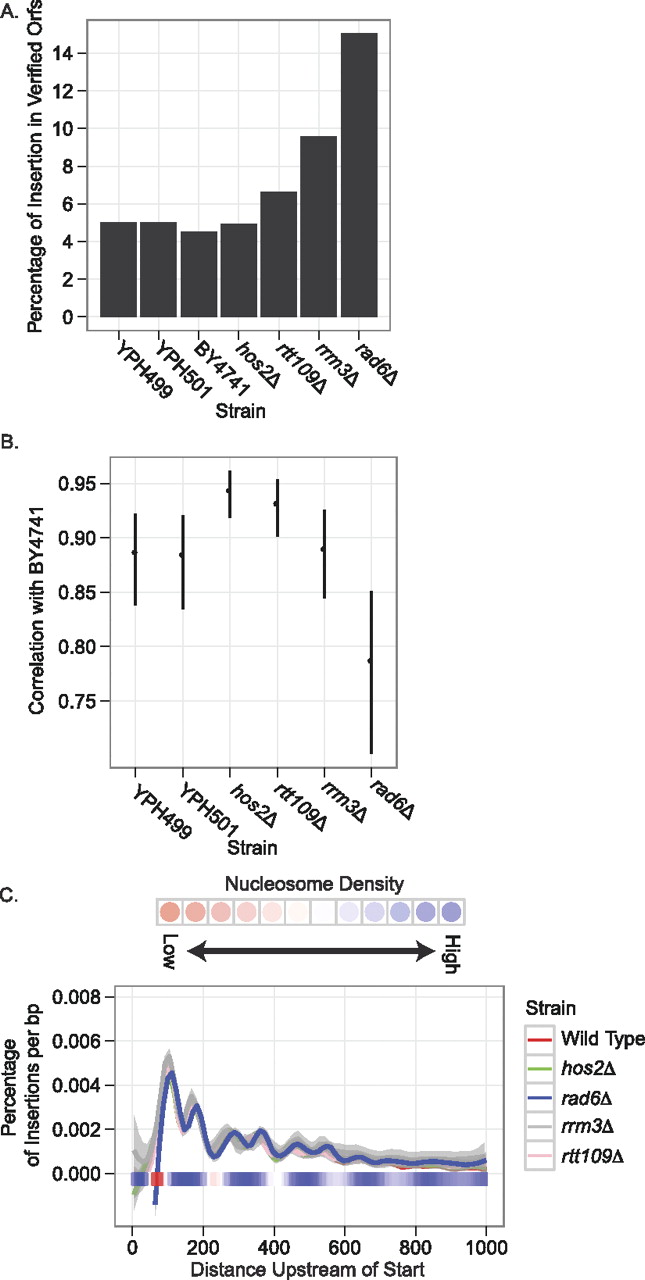
Distribution of Ty1 insertions in mutant strains. (A) Percentage of insertions that occurred in verified ORFs in different wild-type and mutant strains. (B) Pairwise Spearman correlations between strains based on the number of insertions in 2-kb windows upstream of class III genes. This provides a measure of the consistency in targeting between strains to particular class III genes. BY4741 serves as the reference strain. Error bars represent a P-value of 0.001. (C) Pattern of targeting upstream of class III genes in wild-type and mutant backgrounds. The graph is the same as described in Figure 4A with the exception that only the spline-smoothed data is shown. Also, the y axis has been normalized with respect to the total number of insertions in the upstream region. Shading around each spline denotes error for the approximation at P = 0.05.


