
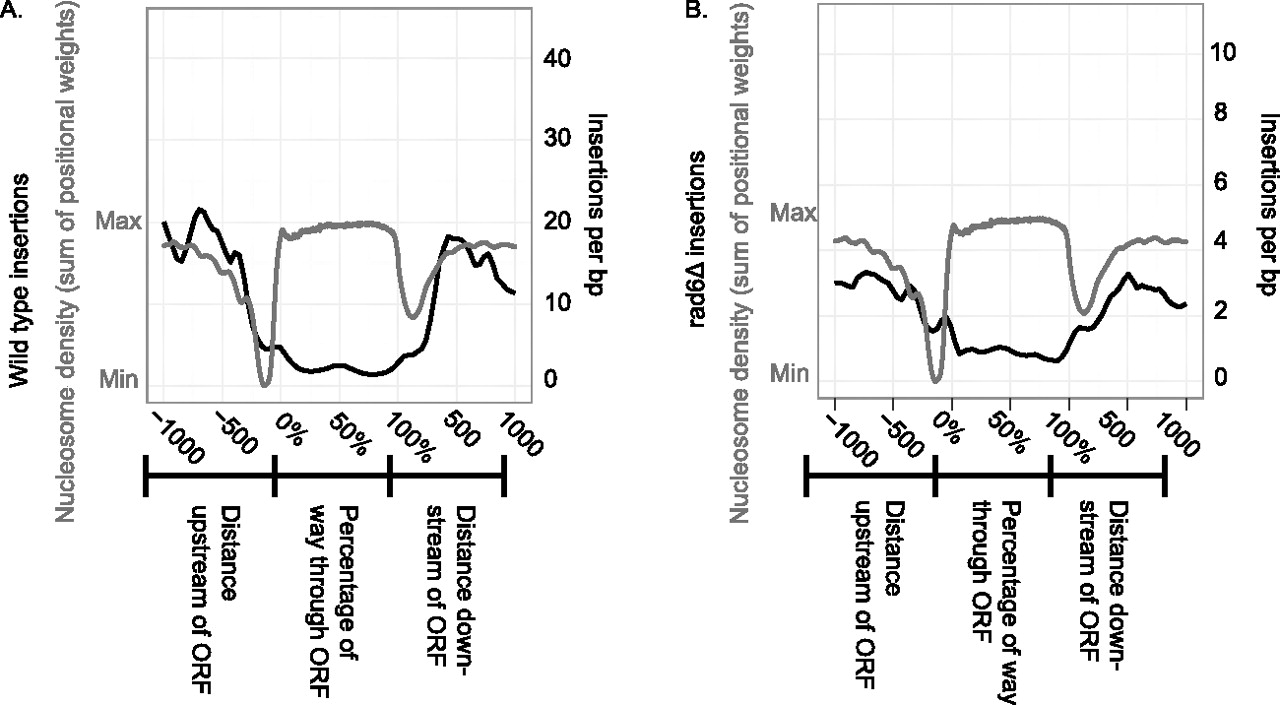
Figure 6.
Association of Ty1 insertions with class II genes. The x axis describes the area within and around class II genes. Regions 1 kb upstream of and downstream from the coding region are shown. The falloff in insertions further from the ORF was due to intergenic regions shorter than 1000 bp. Coding regions are depicted as a normalized scale. The y axis describes nucleosome density (gray) or the number of Ty1 insertions (black) in A wild type of B, rad6Δ strains.


