
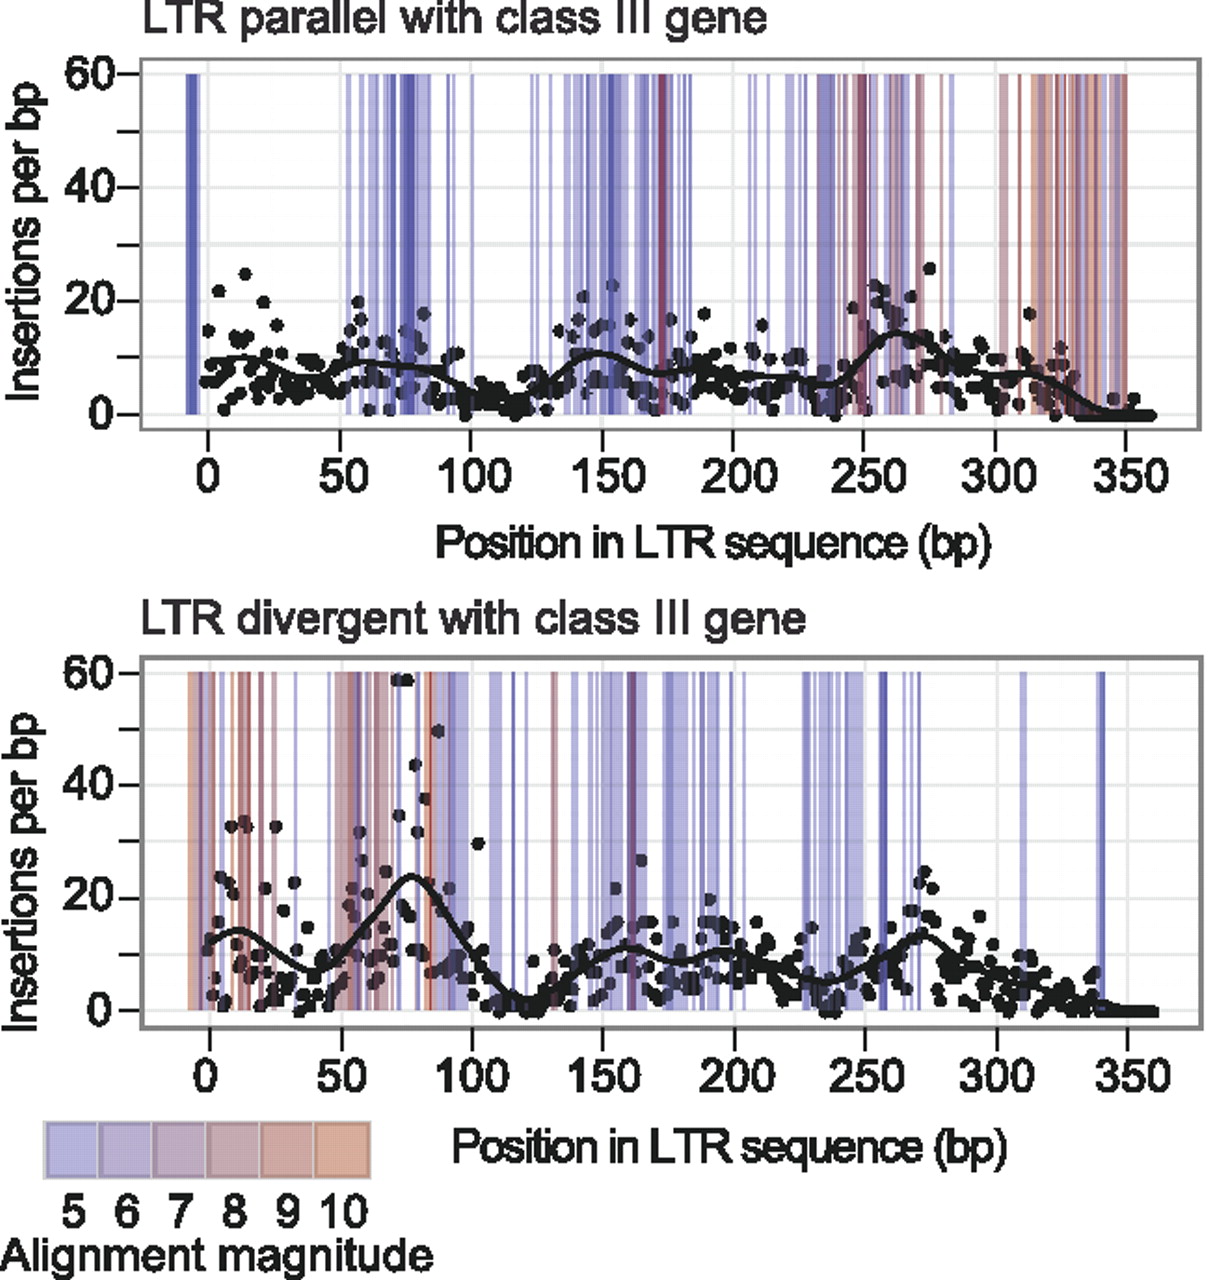
Association of Ty1 insertions with endogenous Ty1 LTRs. Ty1 insertions in a canonical Ty1 LTR were plotted. Separate plots were generated for insertions in LTRs (represented by black dots) in the same orientation (parallel, upper plot) or opposite orientation (divergent, lower plot) with respect to the direction of transcription of the adjacent class III gene. The distance was then calculated between the end of the LTR and the start of transcription of the adjacent class III gene. Using this distance, the expected position of integration peaks were plotted based on the data in Figure 4A. These expected peaks are shown in the plots as colored lines. The gradient of pink to blue color denotes the expected magnitude of the peaks observed at increasing distances from the start of transcription: pink represents the highest peak expected, and blue the lowest. The alignment of the colored bars with the insertion peaks (black dots) suggests that the nonrandom distribution of insertions across the LTR is due to integration into phased nucleosomes upstream of class III gene targets.


