
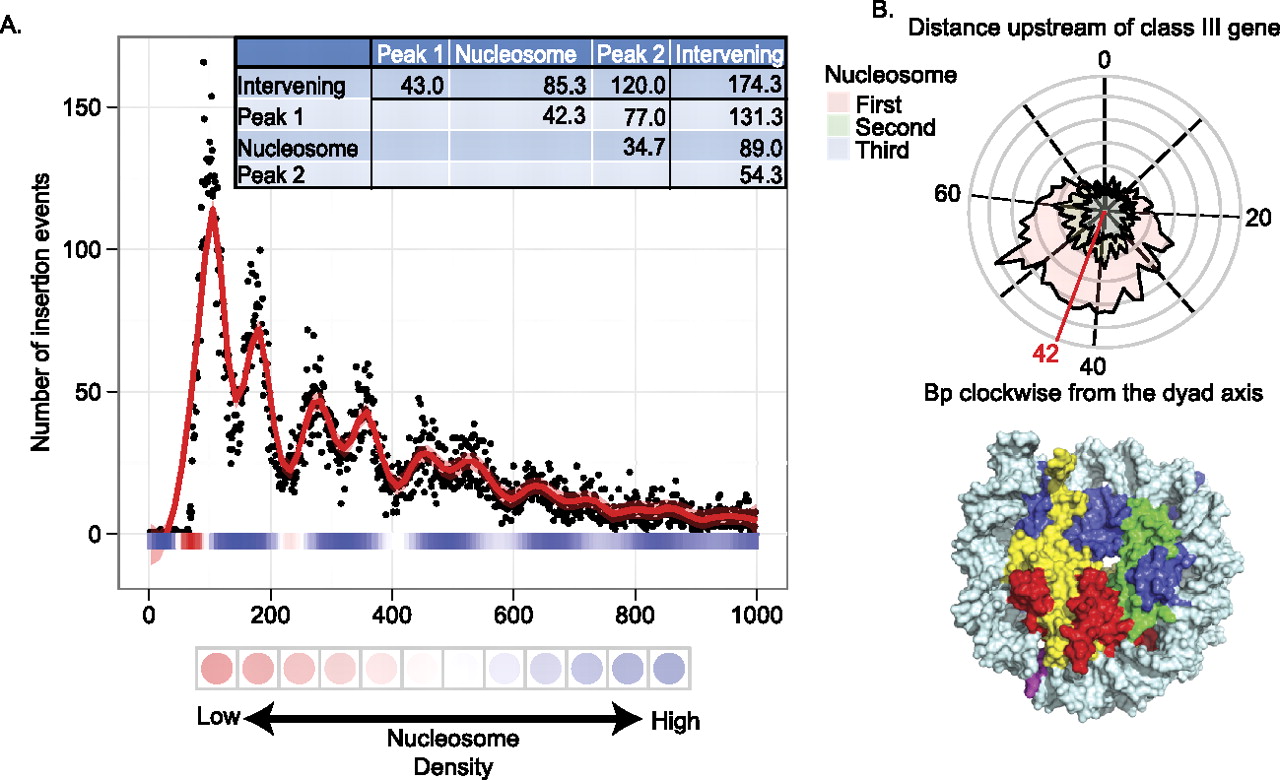
Association of Ty1 insertions with nucleosomes. (A) Ty1 insertions upstream of class III genes were plotted in a single distribution relative to the start of transcription (position 0 on the x axis). Nucleosome density is depicted by the color of the x axis (Lee et al. 2007). Blue denotes the presence of nucleosomes; red denotes the lack of nucleosomes. The intensity of the color indicates the strength of the signal. The y axis indicates the number of insertions per 10 bp. The red line in the graph depicts the spline-smoothed data. The spline identifies three periods, each with two peaks and two troughs. The deepest troughs (intervening) occur at approximately base positions 60, 220, 400, and 590. The other troughs occur within nucleosome-rich regions. Peak1 is the highest peak in each period; peak2 is the lowest. The inset provides calculated average distances (in base pairs) between features in the spline-smoothed data. (B) A radial plot depicting the distribution of insertions relative to the wrapping of DNA in nucleosomes. Each rung of the radial plot denotes 20 insertions. The 0 point is the dyad axis of the nucleosome. The three colors indicate the three periods observed in A. “First” denotes the plot of insertions that occurred within DNA bound by the first nucleosome upstream of the transcription start site; “Second” denotes insertions within the second nucleosome, etc. Note that the two peaks of insertions within a period are coincident on the nucleosome, and the red line indicates the coincident peaks of the spline-smoothed data. Below the radial plot is a space-filling model of a nucleosome. (Yellow) H2A; (red) H2B; (blue) H3; (green) H4. The position on the nucleosome-bound DNA of the coincident peaks of the spline-smoothed data is marked in pink.


