
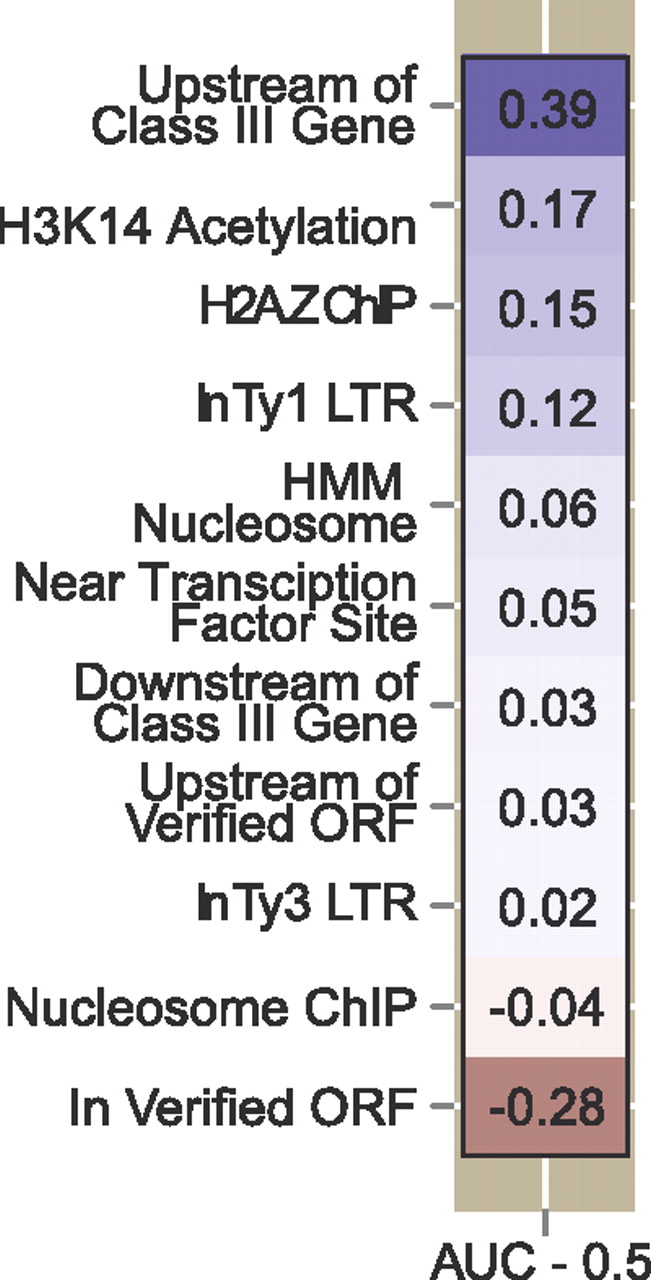
Figure 3.
Association of Ty1 insertions with different chromosomal features. Only a subset of features are shown for which significant positive (blue) or negative (red) AUC values were obtained by logistic regression. The color intensity denotes the strength of the association. Actual values shown are AUC-0.5. The analysis treated each base pair as a potential insertion site.


