
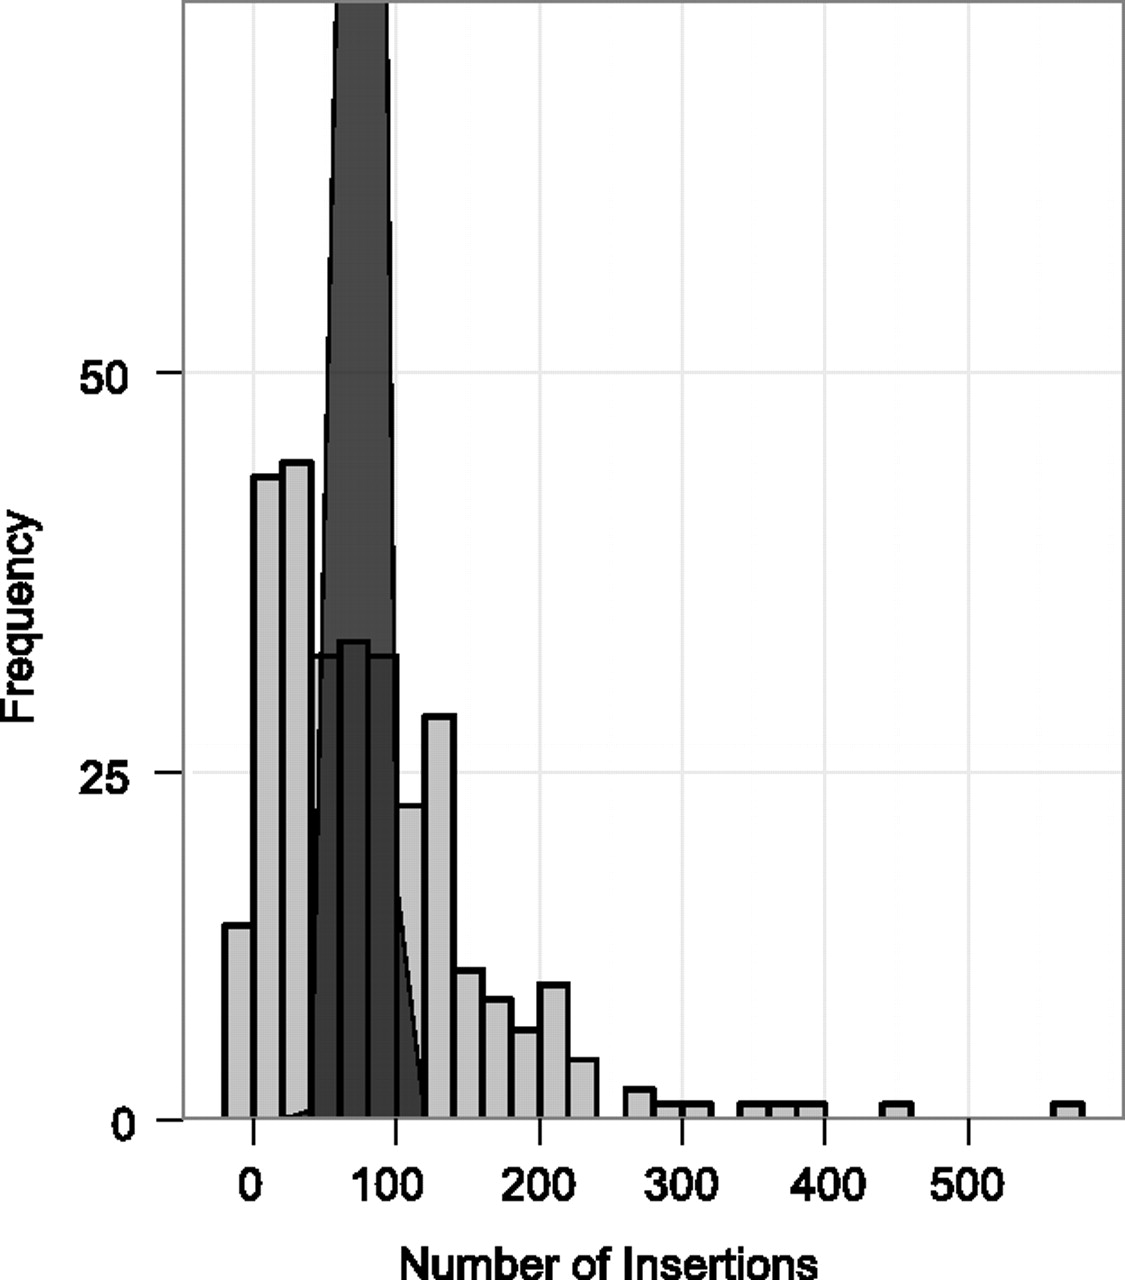
Figure 2.
Histogram of Ty1 insertion frequency per class III gene. The x axis depicts the number of Ty1 insertions within a 2-kb window upstream of each class III gene in the S. cerevisiae genome. Values on the y axis indicate the number of class III genes with a given number of insertions. The curve denotes the pattern expected for random selection of class III gene targets.


