
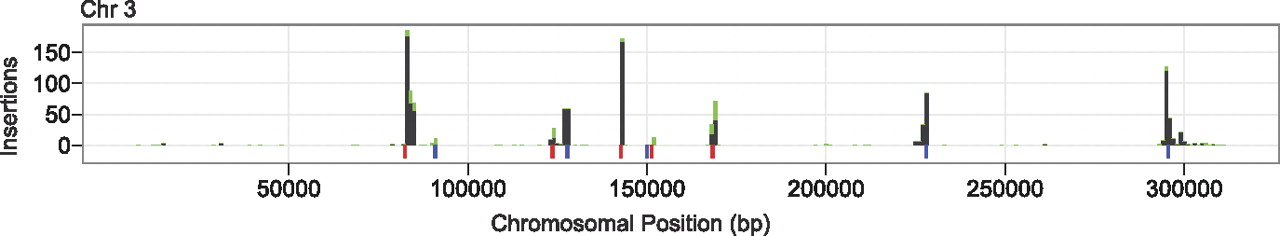
Figure 1.
Distribution of Ty1 insertions on chr 3. The x axis denotes position along the chromosome at 1 kb resolution. (Black bars) Number of unambiguous insertions at a particular site. (Stacked green bars) Ambiguous insertions. Colored bars below the x axis indicate positions of class III genes. (Blue) Genes transcribed from left to right. (Red) Genes transcribed in the opposite direction.


