
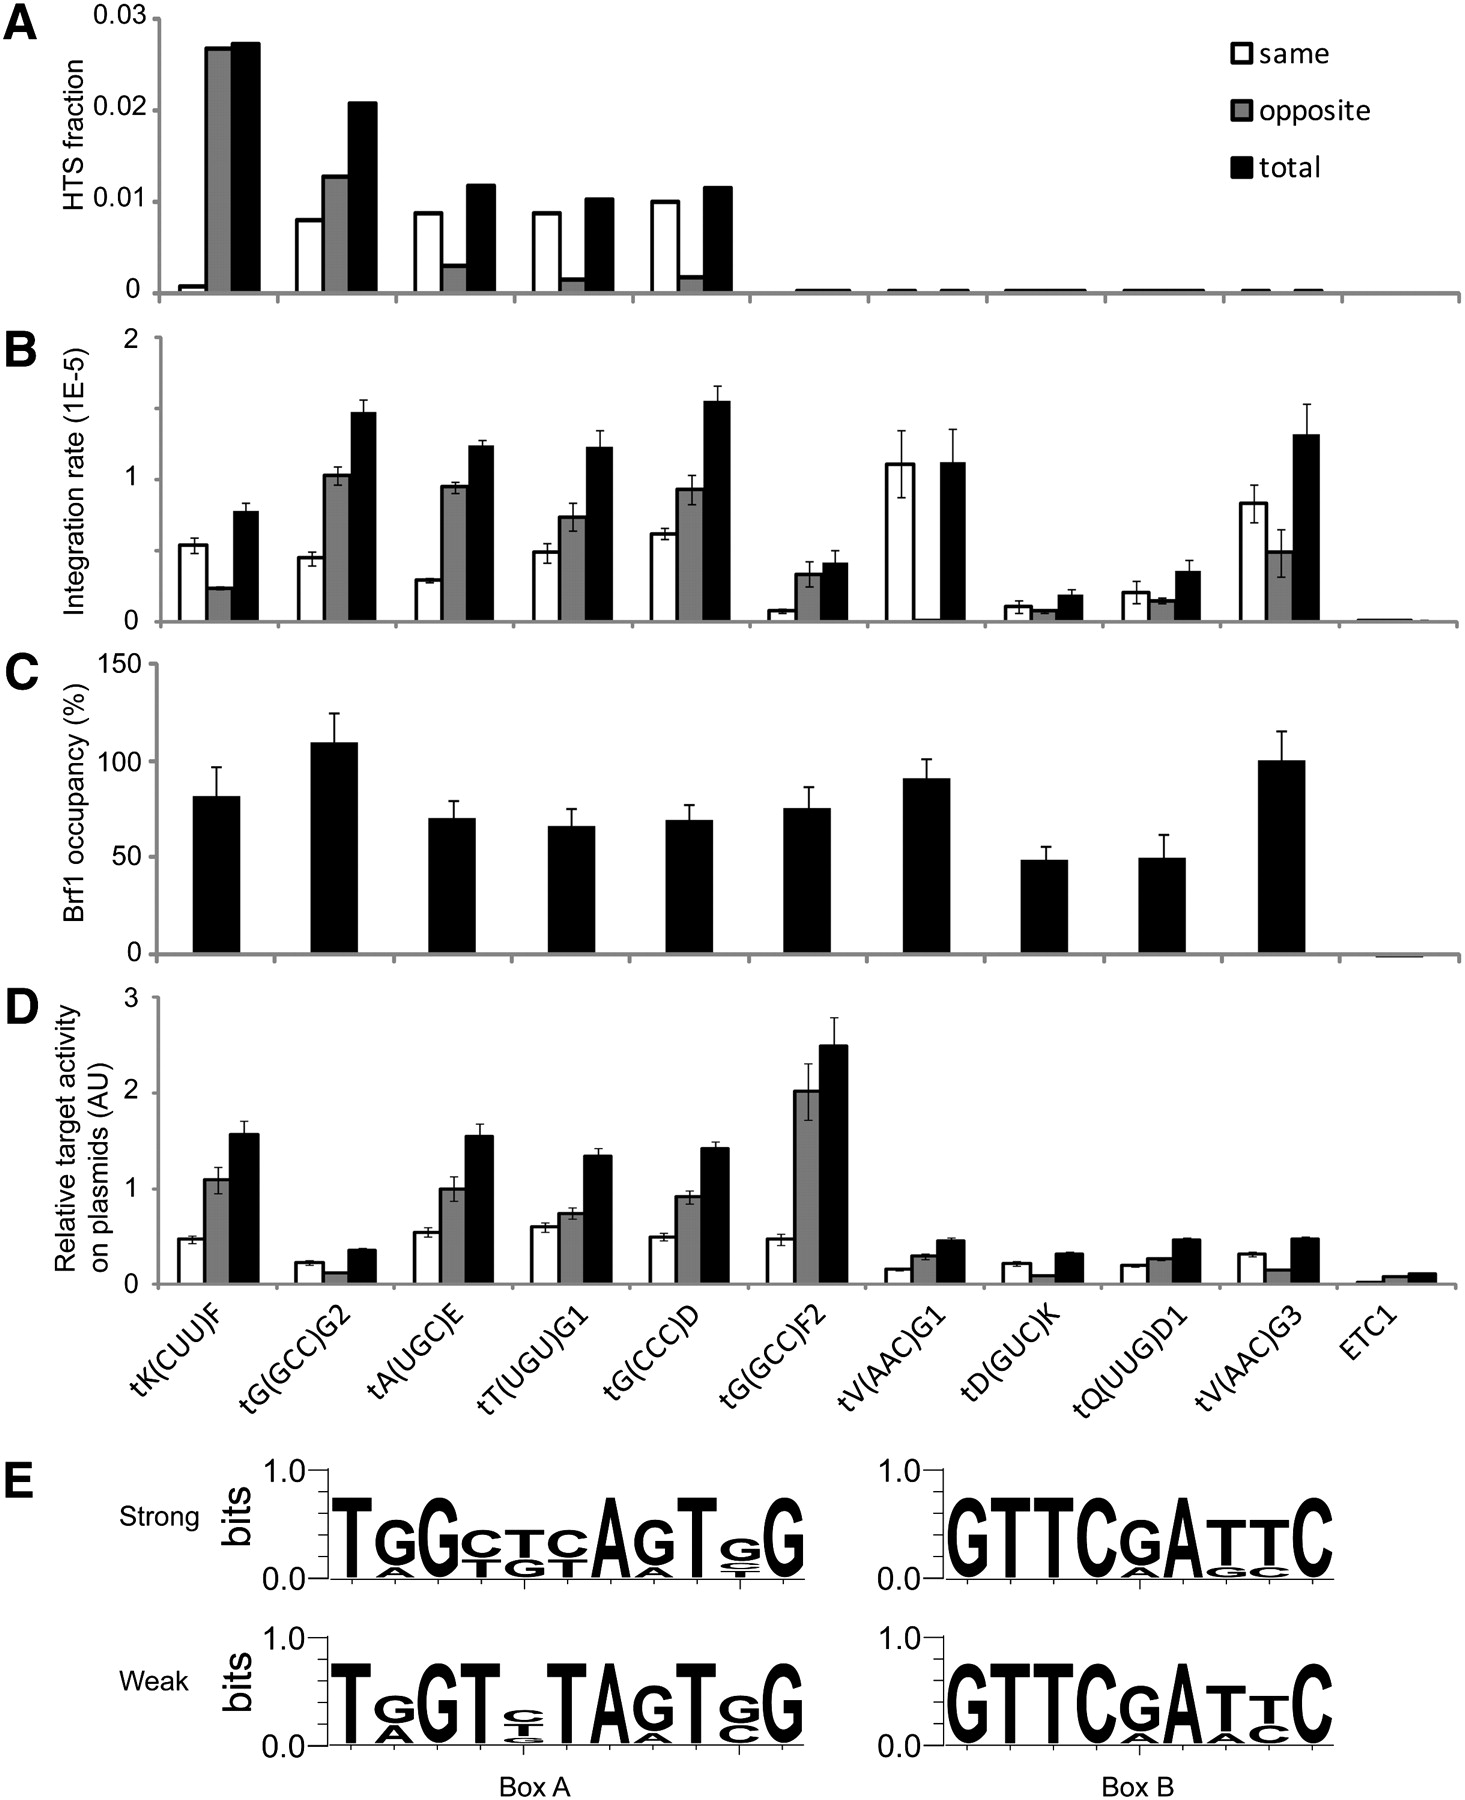
Quantitative Ty3 transposition at tDNAs with high and low DNA sequencing reads. (A) Distribution of sequencing reads from five top decile tDNA clusters and five bottom decile tDNA clusters. Yeast strains YMA1322 and YMA1356 transformed with Ty3-HIS3 expression plasmid pKN3050 were induced for Ty3 expression for 24 h. Insertions into tDNA target clusters were ranked by number of reads, and example top and bottom decile genes (shown) were selected. ETC1 was not detected by sequencing and was used as a negative test case. Bars show reads in which Ty3 and target are transcribed in the same (open) and divergent (gray) orientations and the total (black) is shown. (B) YMA1322 transformed with Ty3-ppt expression plasmid pKN3097 was induced for Ty3-ppt expression as described in A, and Ty3 integrations at reporter target loci were measured using qPCR (Methods). Measurements were within the linear range as standardized using plasmid versions of the Ty3 insertions at each locus. Bars represent technical triplicates of biological duplicates. (C) TFIIIB occupancy of reporter Ty3 target loci. Yeast strain YKN1692 expressing TFIIIB subunit Brf1 tagged with 3HA and transformed with empty URA3 vector plasmid YCplac33 was grown under inducing conditions for 24 h, and Brf1 occupancy at reporter loci was measured using ChIP. ChIP values were determined relative to an ACT1 control. The fold of enrichment for tDNA reporter tV(AAC)G3 to ACT1 was 73:1. The data are expressed relative to the fold enrichment at tV(AAC)G3 set at 100%. (D) Ty3 integration frequencies at tDNA reporter loci and flanking sequence. YMA1322 transformed with Ty3-ppt plasmid pKN3097 and vector pXP622 containing reporter target loci and flanking sequence (120 bp upstream and downstream of target gene) was induced to express Ty3 for 36 h, and integrations were quantified by qPCR. Data are expressed as described in B. (E) Based on target activity (D), promoter elements in strong target loci [tK(CUU)F, tA(UGC)E, tT(UGU)G1, tG(CCC)D, and tG(GCC)F2] and weak target loci [tG(GCC)G2, tV(AAC)G1, tD(GUC)K, tQ(UUG)D1, and tV(AAC)G3] were analyzed for consensus using logo sequence analysis software (http://weblogo.berkeley.edu).


