
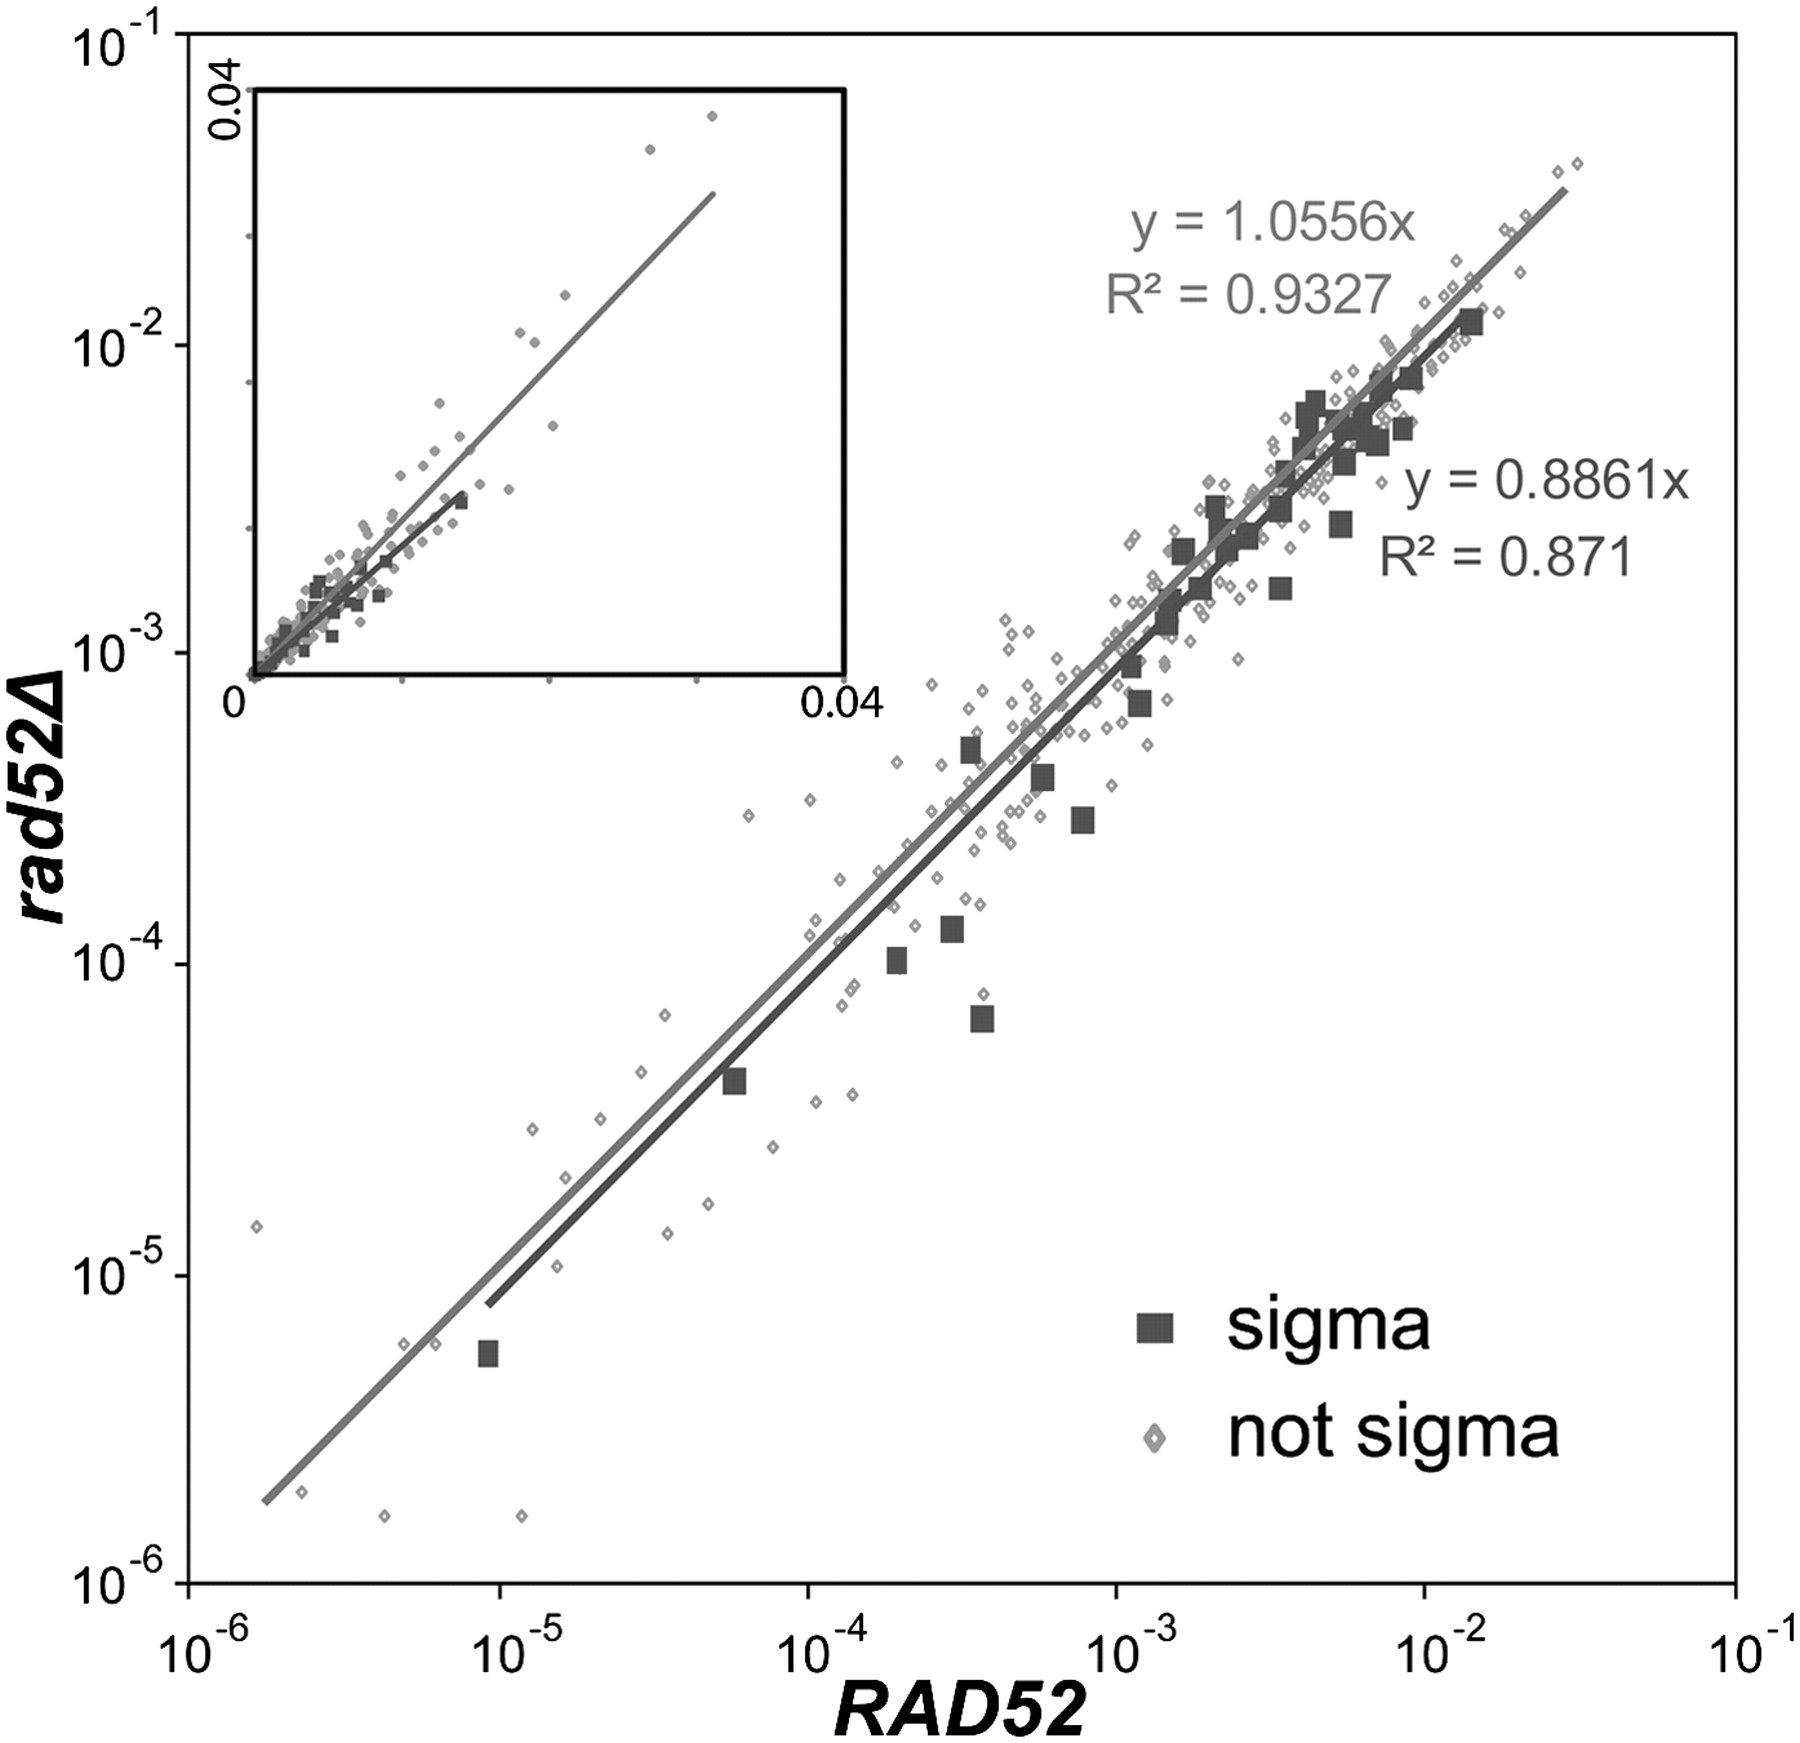
Figure 3.
Targets with preexisting Ty3 LTRs were used at a slightly greater frequency in the presence of RAD52. Cluster densities determined in RAD52 (x-axis) and rad52Δ (y-axis) strains are shown as the fraction of total cluster densities per experiment in log scale (inset in linear scale). Clusters at targets with preexisting Ty3 LTRs (sigma; solid squares, lower line and description) and clusters at unoccupied sites (not sigma; dots, upper line and description) were plotted.


