
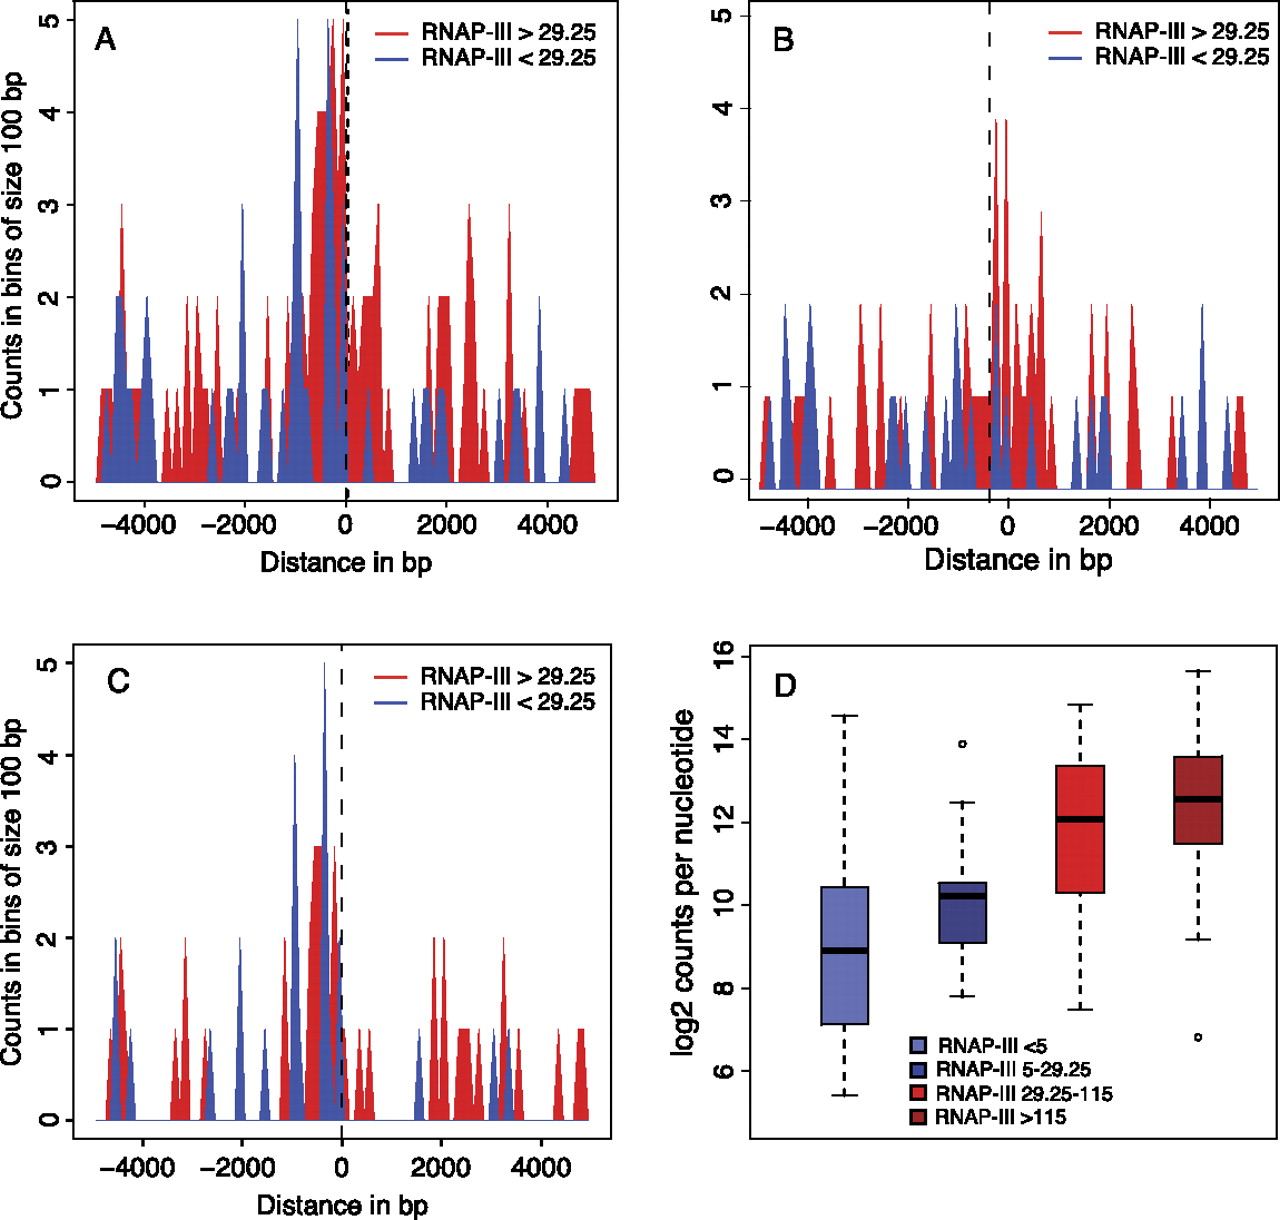
RNAP-III-occupied tRNA genes are often close to transcribed RNAP-II genes. (A) RNAP-III-occupied tRNA genes are often close to RNAP-II TSSs. The horizontal axis shows the distance separating RNAP-III and RNAP-II TSSs (0 indicates the RNAP-III TSS; negative and positive numbers indicate the regions upstream of and downstream from the TSS, respectively). The vertical axis indicates the number of tRNA genes in bins of 100 bp, separated into genes with RNAP-III occupancy scores >29.25 (red) and <29.25 (blue). (B,C) As in A, but only the RNAP-II genes transcribed in the same or opposite strand, respectively, as the tRNA gene are shown. (D) Box plots show tRNA genes with scores <5 (blue box), between 5 and 29.25 (dark blue box), between 29.26 and 115.37 (bright red box), and higher than 115.37 (dark red box). (Vertical axis) Highest number of POLR2B tags in 500-bp regions centered on an RNAP-II TSS found within 5 kb upstream of and 5 kb downstream from each tRNA gene.


