
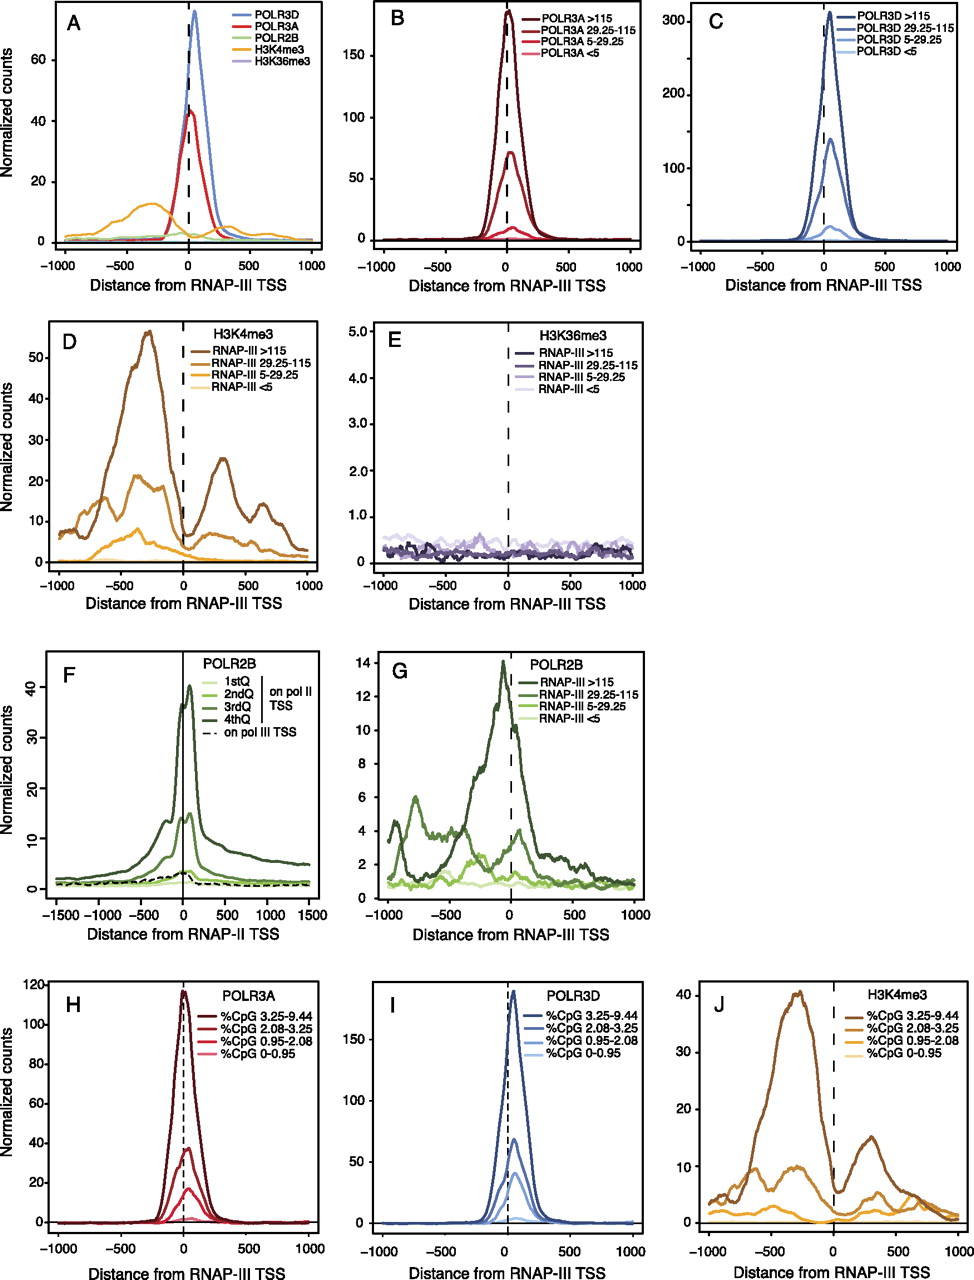
Average tag density profiles for RNAP-II and RNAP-III subunits and some histone marks. Two hundred and six tRNA genes (117 with scores <5; 26 with scores between 5 and 29.25; 28 with scores between 29.26 and 115.37; 35 with scores >115.37) removed by at least 1000 bp from the nearest RNAP-III or mRNA-encoding RNAP-II transcription unit were selected for this analysis. An analysis with genes removed by at least 1000 bp from RNAP-III and all RNAP-II transcription units including those encoding noncoding RNAs gave identical results (159 genes, 83 with scores <5; 23 with scores between 5 and 29.25; 24 with scores between 29.26 and 115.37; 29 with scores >115.37; data not shown). (A) Average tag density profile for the factors indicated on all 206 genes. (B–E,G) average tag profile for the indicated factors on genes with RNAP-III scores smaller than 5, between 5 and 29.25, between 29.25 and 115.37, and larger than 115.37, as indicated. (F) Average POLR2B tag profile on RNAP-III TSS (dotted line) and, for comparison, on RNAP-II TSS divided into quartiles with the lowest (first quartile) to the highest (fourth quartile) level of RNAP-II indicated by lines of darkening shades of green. (H–J) Tag profile for POLR3A, POLR3D, and H3K4me3, as indicated, on 206 isolated tRNA genes divided according to the percentage of CpG dinucleotides (in a region extending from 300 nt upstream of the TSS to 100 nt downstream from the RNA coding region).


