
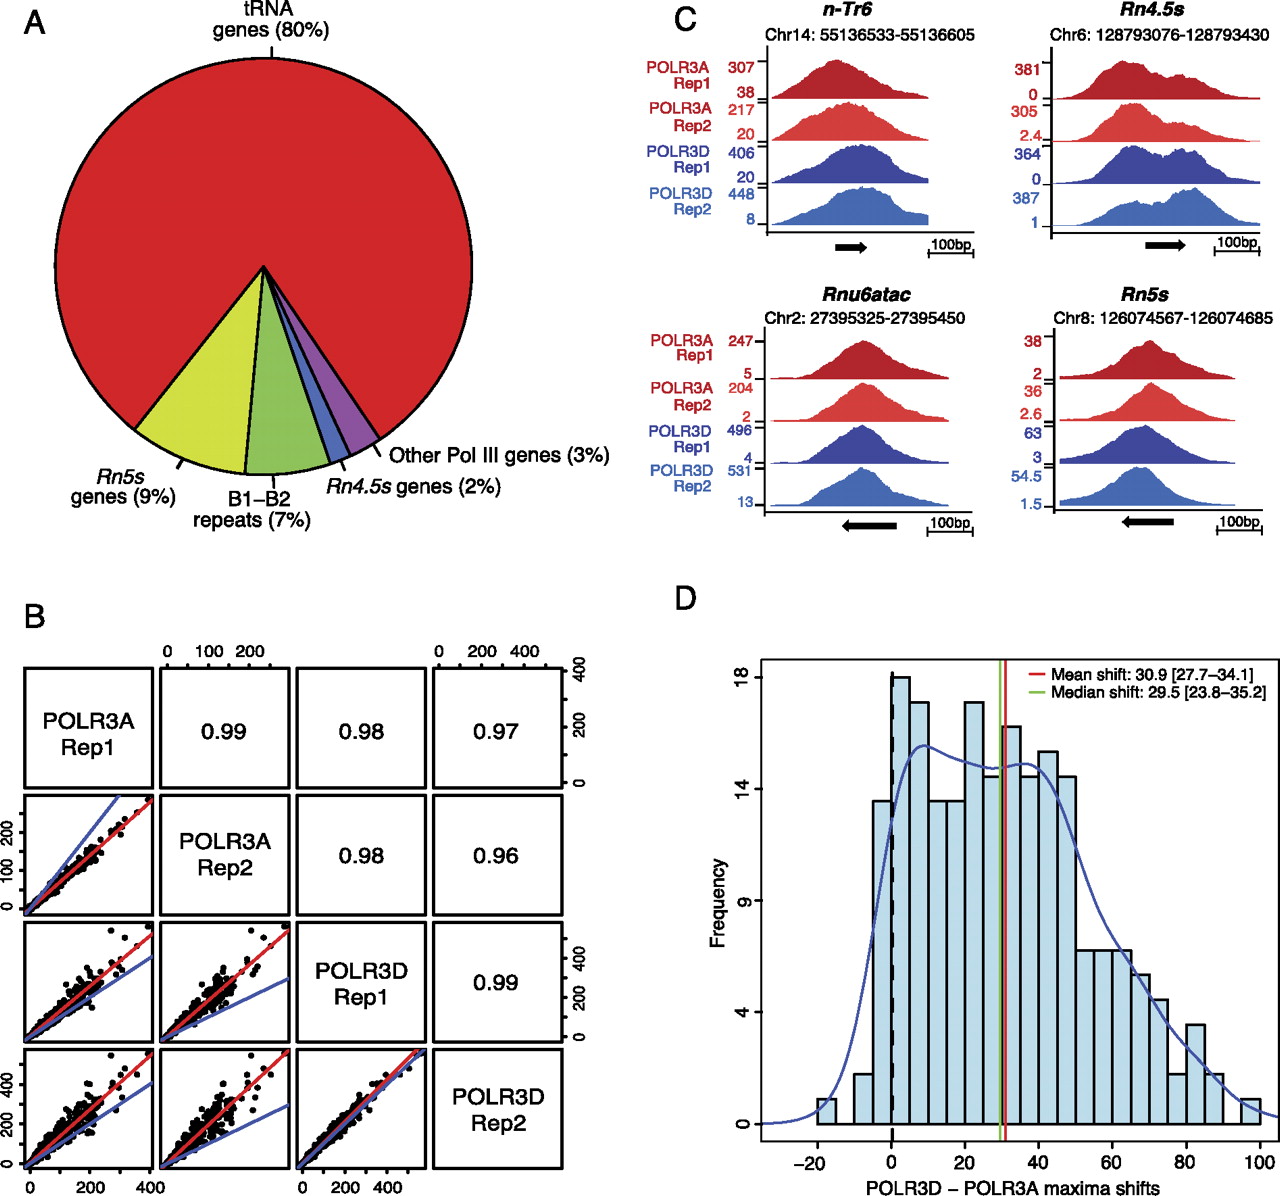
Identification of RNAP-III-occupied loci in mouse liver. (A) The pie chart summarizes the RNAP-III-occupied genomic regions in the mouse liver as determined by peak detection (Canella et al. 2010; see also Methods). The “other RNAP-III genes” category contains the known RNAP-III genes other than tRNA, Rn5s, and Rn4.5s (listed in Supplemental Table S3). (B) Pearson correlations of linear scores obtained with the anti-POLR3A and anti-POLR3D antibodies for the rep1 and rep2 biological replicates, as indicated. All loci listed in Supplemental Tables S1–S5 are included. The regression line is indicated in red, the y = x line in blue. The Pearson correlation coefficients are indicated in the squares in the top right. (C) UCSC browser views showing POLR3A and POLR3D peaks on a tRNA gene (n-Tr6, chr14, tRNA209-ArgACG), a Rnu6atac gene, a Rn4.5s gene, and a Rn5s gene. (D) The POLR3A and POLR3D peaks are offset relative to one another. The shift between the POLR3A and POLR3D peak summits (in a region from −30 to +70 around the TSS) for all tRNA genes with scores above 29.25 is shown on the x-axis, with the frequency on the y-axis. The mean and median shift values are indicated, together with the confidence interval (computed by the bootstrap method at 95% confidence interval).


