
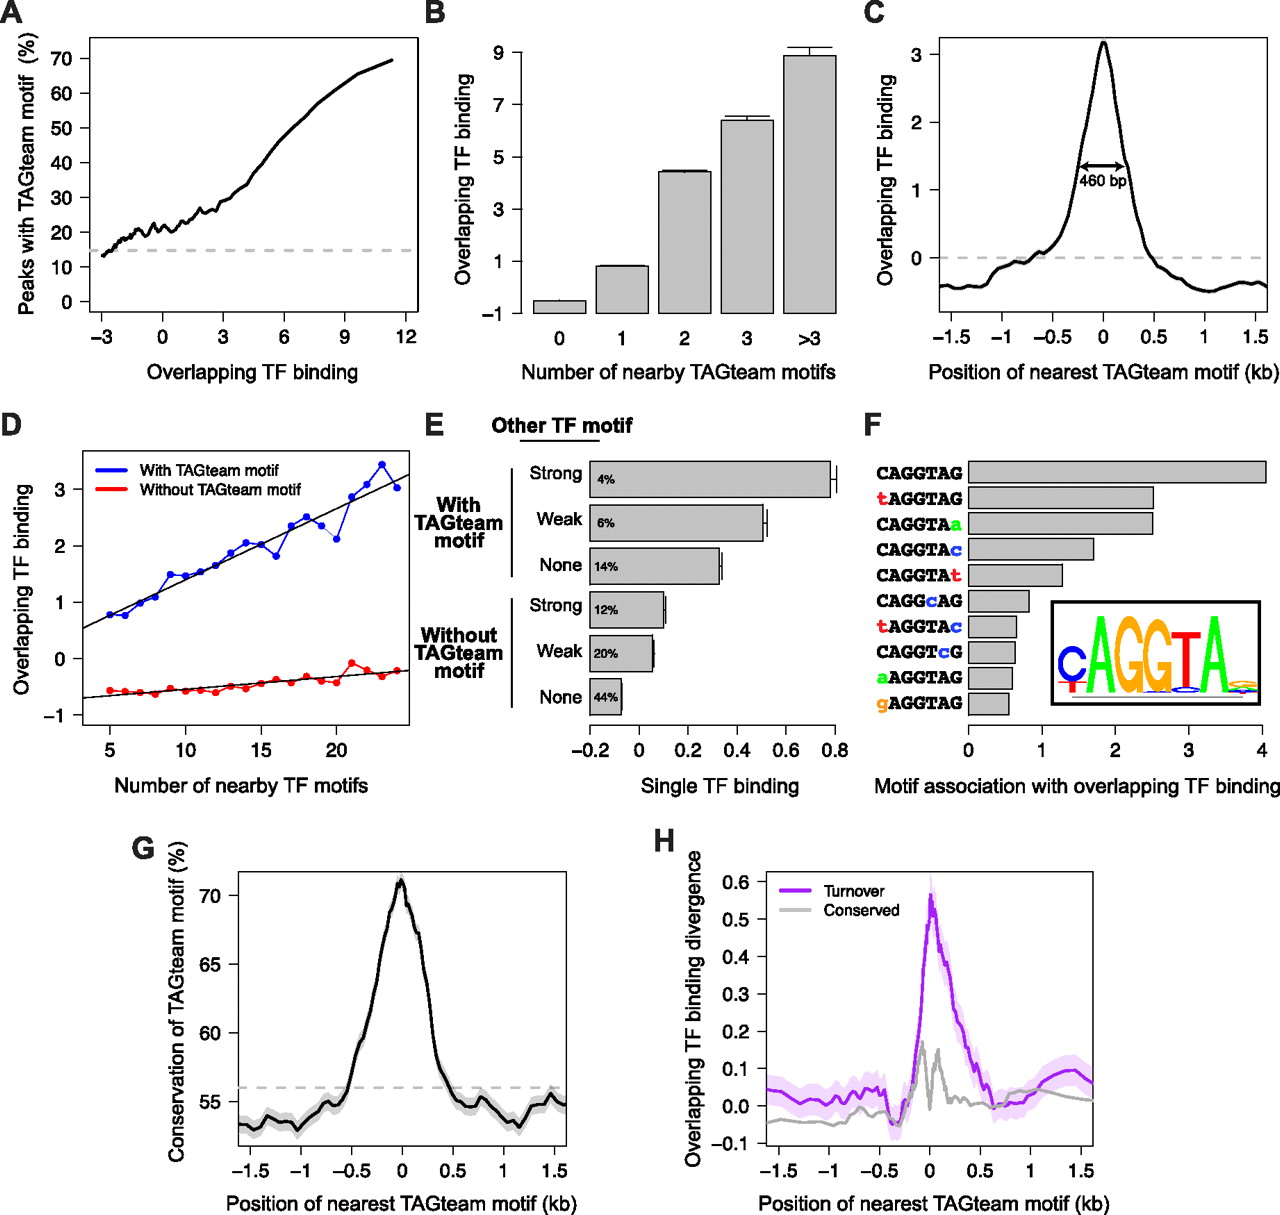
TAGteam motifs are associated with nearby binding of many transcription factors. (A) The fraction of ChIP peaks with nearby TAGteam motifs increases with levels of binding of all factors. “Overlapping TF binding” indicates levels of binding of all factors in arbitrary units (measured as the first principal component of our PCA analysis; see text), where 0 is the mean over ChIP peaks. (Dashed gray line) Genome-wide average frequency. For A,C,D,G, and H, shading around plotted lines indicates standard error of the mean (too small to be visible in some plots). (B) Binding at ChIP peaks increases with the number of nearby TAGteam motifs (within 500 bp). (Error bars) Standard error of the mean. (C) ChIP peaks with nearby TAGteam motifs exhibit high levels of binding. Plot indicates the position of the TAGteam motif closest to each ChIP peak (x-axis) and the corresponding binding level at the ChIP peak (y-axis). (Double-headed arrow) Distance at which the association between TAGteam motifs and binding falls by 50%. (Dashed gray line) Average level of binding (averaged over all ChIP peaks). (D) Number of nearby transcription factor binding sites globally correlates with levels of binding only when TAGteam motifs are present. Restricting to the 14 factors with well-defined binding sites, we computed the number of binding sites as the total number of PWM matches within 500 bp of each ChIP peak summit, and we searched for TAGteam motifs within the same region. (E) TAGteam motifs may facilitate binding of additional transcription factors in concert with cognate recognition motifs for these factors. Matches to transcription factor binding site PWMs within 100 bp of ChIP peak summits were classified as “strong” (P < 10−5), “weak” (10−5 < P < 10−4), or absent. Percentages indicate the fraction of ChIP peaks that fall into each category. “Single TF binding” indicates levels of binding of single transcription factors, averaged over all 14 factors with well-defined binding sites, in arbitrary units, where 0 is the mean over ChIP peaks. (Error bars) Standard error of the mean. (F) CAGGTAG, tAGGTAG, and CAGGTAa are the TAGteam motifs most highly associated with binding of all factors. We ranked each 2-bp polymorphism of the consensus TAGteam motif by its association with overlapping binding, measured as the peak height illustrated in C, but restricted to a single heptamer. (Inset) PWM determined from this ranking of heptamer effectiveness, plotted with seqLogo (http://bioconductor.org/packages/2.6/bioc/html/seqLogo.html). (G) TAGteam motifs near ChIP peaks exhibit increased conservation. Plot indicates the position of the TAGteam motif closest to each ChIP peak (x-axis) and the corresponding motif conservation between D. melanogaster and D. yakuba (y-axis). (Dashed gray line) Genome-wide average conservation of TAGteam motifs. (H) Gain/loss of TAGteam motifs is associated with divergence in nearby binding between D. melanogaster and D. yakuba. Plot indicates the position of the TAGteam motif closest to each ChIP peak in one species (x-axis) and the corresponding divergence in overlapping binding at the ChIP peak in the other species (y-axis), averaged over all ChIP peaks detected in either species.


