
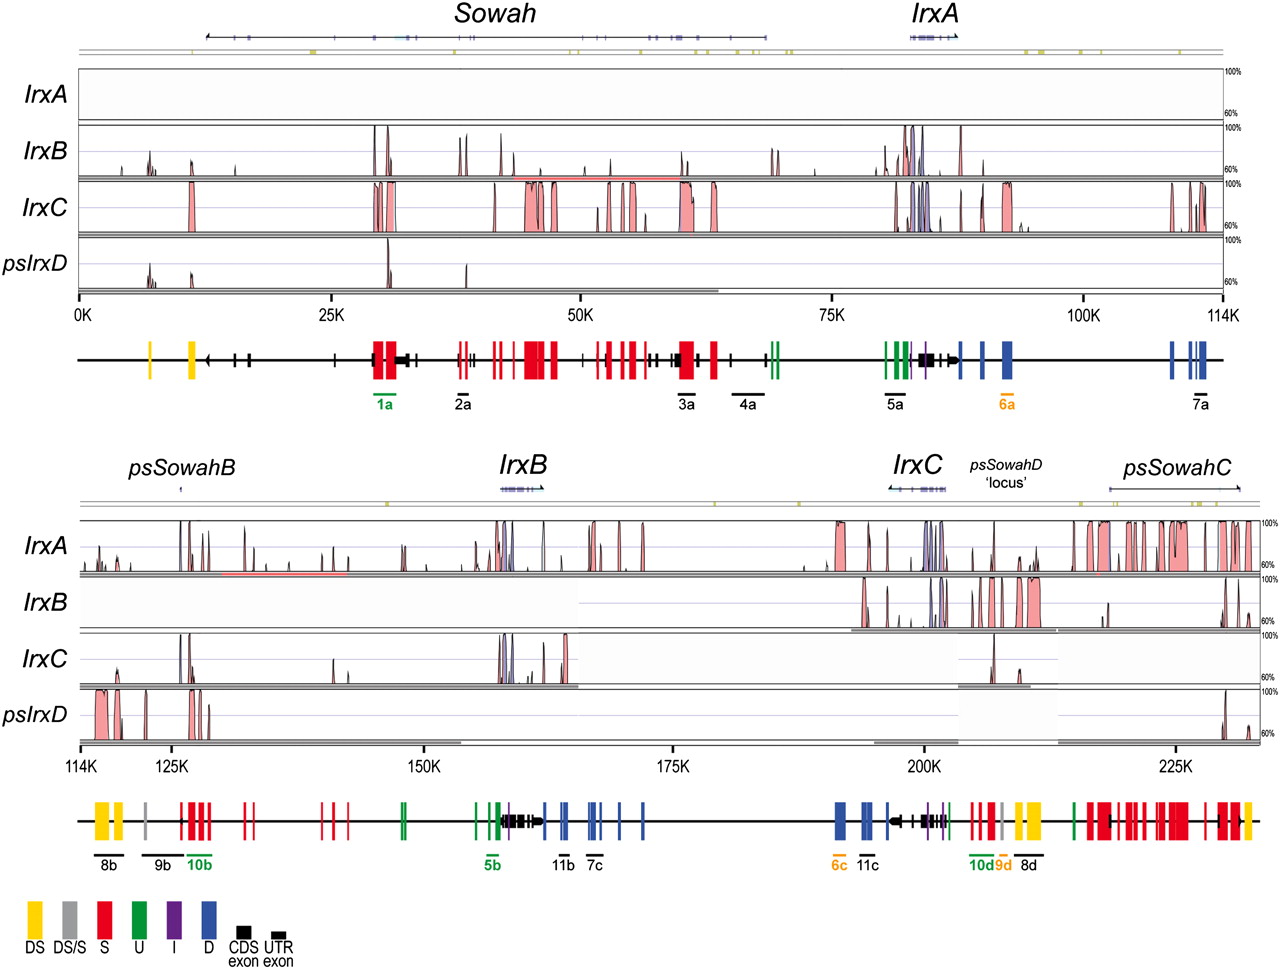
Internal organization of the Irx-Sowah complex in B. floridae. VISTA plot of the alignments between each of the three Irx genes (plus a fourth region corresponding to a putative IrxD locus lost during amphioxus evolution) and their respective surrounding noncoding regions, including Sowah in the case of IrxA. Colored peaks (blue, coding; turquoise, UTR; pink, noncoding) indicate regions of at least 100 bp and ≥70% similarity. High-copy number elements (such as repeats and mobile elements) are masked and their presence is indicated by khaki segments above the VISTA plot. Vertical bars of different colors below the VISTA plot represent the different conserved repeated blocks, indicating their respective location to Sowah and Irx loci (DS, Downstream Sowah; S, within Sowah; U, Upstream Irx; I, Introns of Irx; D, Downstream Irx. DS/S bars indicate elements of uncertain identity [DS or S]). Black rectangles and arrows indicate the exon sequences of Irx, Sowah, or the remains of Sowah duplicates. The blocks tested for transcriptional enhancer activity are indicated and named with a number and letter code. The letter refers to the Irx locus with which they are associated; color indicates whether they are tissue-specific enhancers (green), unspecific enhancers (yellow), or negative elements (black).


