
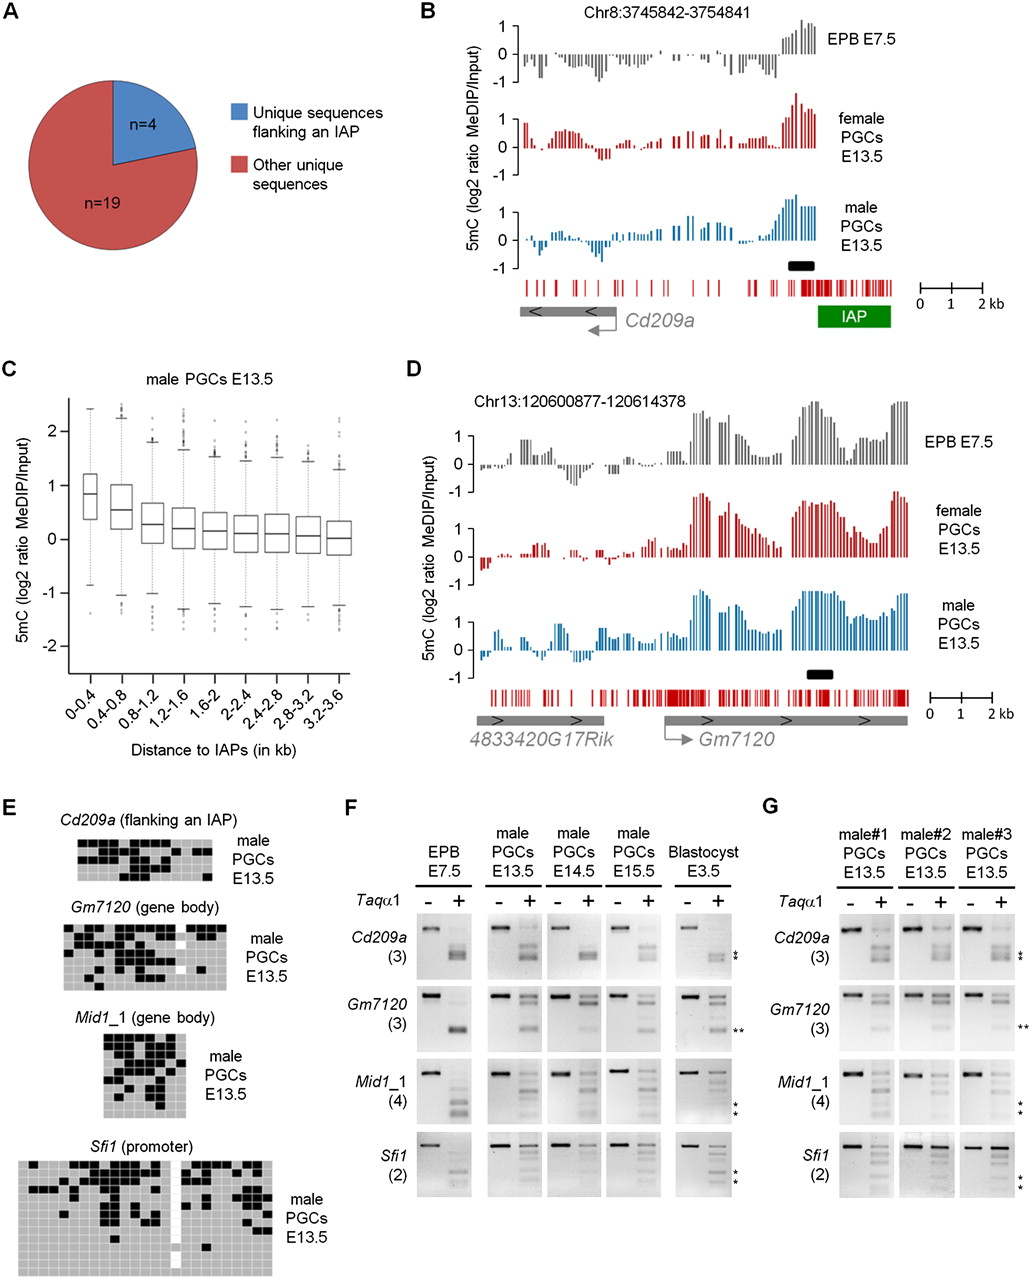
Identification of single-copy regions that resist demethylation in PGCs. (A) Proportions of identified single-copy loci that flank repetitive elements (blue) or are not on the vicinity of repetitive elements (red). (B) Example of MeDIP profiles at a single-copy sequence directly flanking an IAP element. The graphs show smoothed MeDIP over input ratios of individual oligonucleotides. The black box marks the position of the PCR fragment used for COBRA and bisulfite sequencing validations. The genomic position is indicated above the graphs. (C) The box plot represents the distribution of log2 ratios in male E13.5 PGCs as a function of the distance to the border of IAPs, which reveals that single-copy regions in the vicinity of IAPs show increased MeDIP signal. The distribution is identical in female PGCs (Supplemental Fig. 11C). (D) Example of MeDIP profiles at a locus not flanked by repetitive elements that retains cytosine methylation in E13.5 PGCs. (E) Bisulfite sequencing validates the presence of cytosine methylation at various single-copy regions in male E13.5 PGCs, one of them flanking an IAP element (Cd209a). Squares represent CpG dinucleotides as unmethylated (gray), methylated (black), or absent (white). The polymorphic CpG residues at the Gm7120 and Sfi1 loci might represent strain differences. (F) COBRA shows that methylation of single-copy loci is also present in PGCs isolated from the E14.5 and E15.5 male embryo, as well as in preimplantation E3.5 blastocysts. (G) COBRA shows that methylation of single-copy loci is found in E13.5 PGCs isolated from three male individuals, indicating that it is not a stochastic event.


