
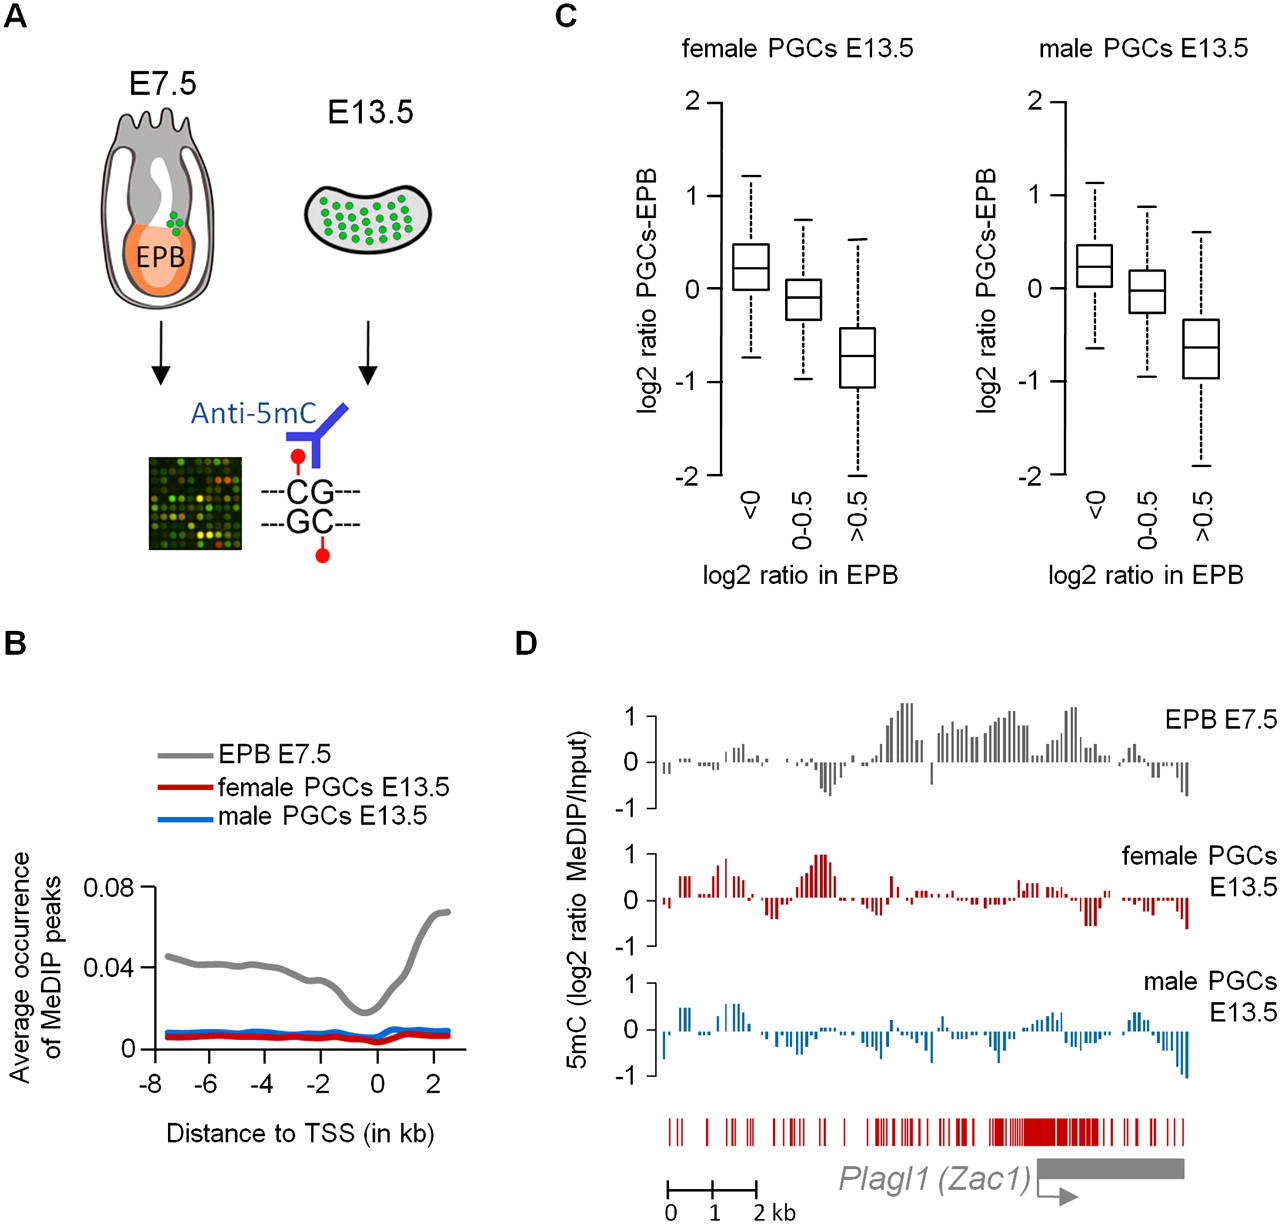
Global absence of cytosine methylation in E13.5 PGCs. (A) We hybridized MeDIP samples from E7.5 epiblasts (EPB) and PGCs (green dots) from E13.5 gonads on NimbleGen HD2 arrays covering 11 kb of all gene promoters in the mouse genome. (B) The graph shows the fraction of tiles with a methylation peak as a function of the distance to the transcription start site (TSS). This shows that the enrichment of cytosine methylation in intergenic regions and gene bodies, typical of somatic cells, is erased in E13.5 PGCs. (C) Differences in oligo log2 ratios between E7.5 epiblasts and E13.5 PGCs. The boxplot shows that regions enriched in epiblasts largely lose the methylation signal in PGCs. (D) Erasure of methylation imprints in male and female E13.5 PGCs illustrated at the Plagl1 locus. (Graphs) Smoothed MeDIP log2 ratios of individual oligonucleotides. Here and in other figures, the gene is shown below the graphs as a gray box, the TSS is shown as a gray arrow, and red bars represent the position of the CpGs.


