
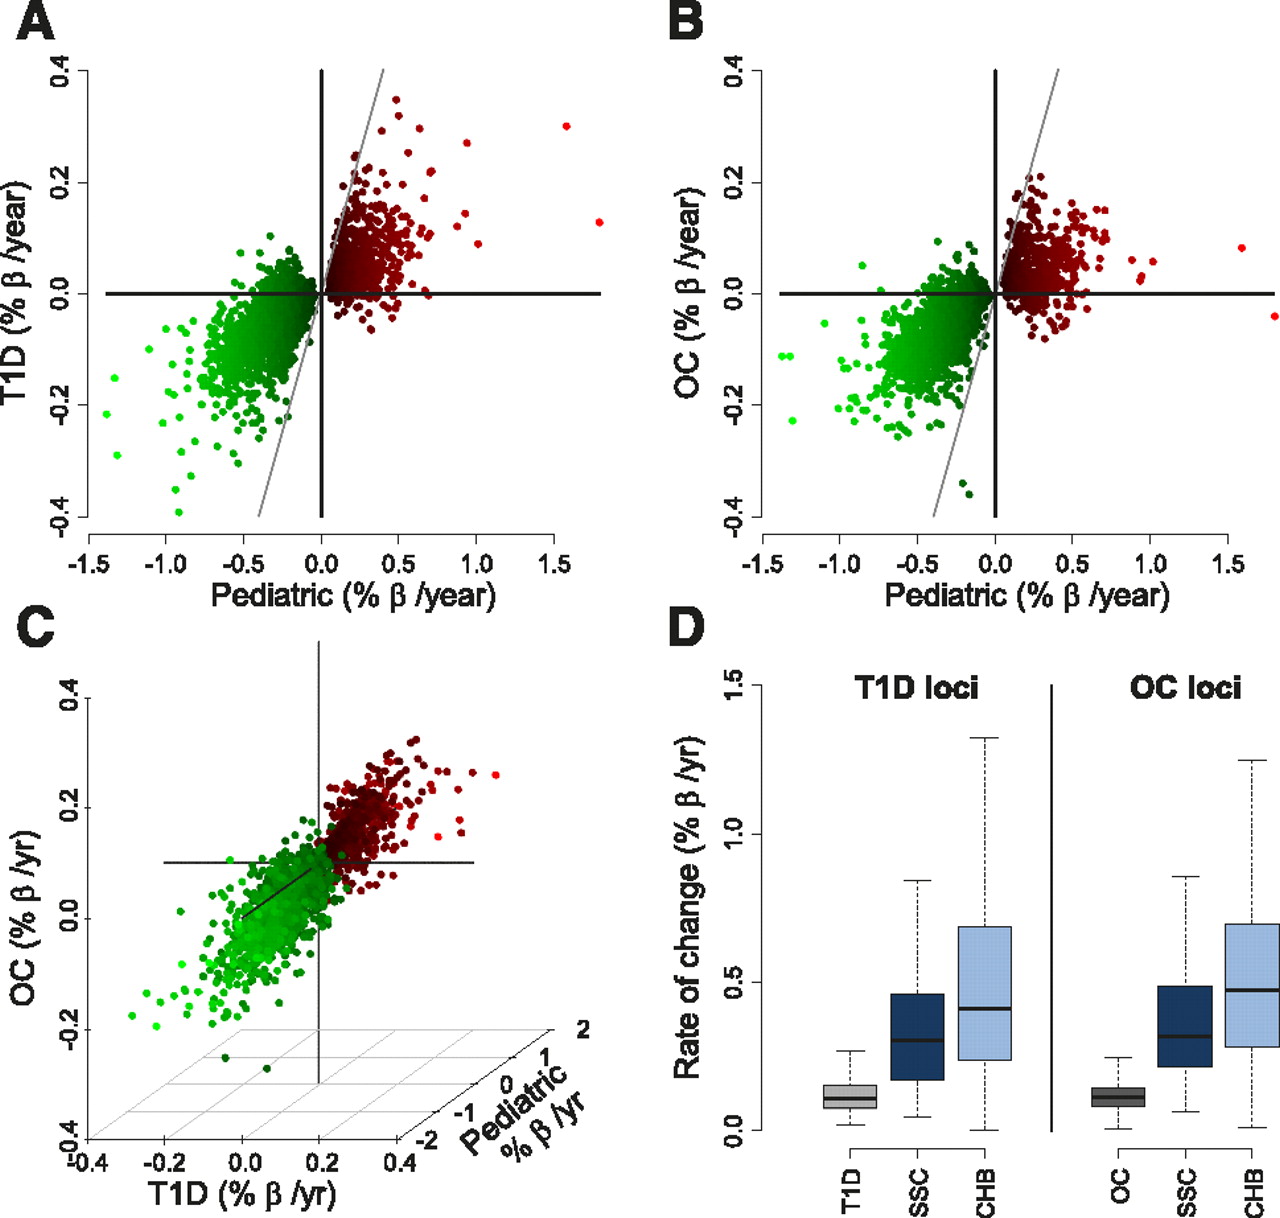
DNA methylation changes in pediatric and adult populations. Scatterplot showing the rates of DNAm change in the SSC pediatric population (x-axis) as compared with the adult T1D (A) and OC (B) populations. Each point represents one of the 2078 CpG loci found significant in the SSC pediatric cohort; points are colored by the rate of DNAm change in the SSC population (larger-to-smaller shown in light to dark colors; green: age-demethylated, red: age-methylated). The diagonal line represents the one-to-one line. (C) Three-dimensional scatterplot showing correlation of the average age-associated rate of DNA methylation in the SSC (z-axis), T1D (x-axis), and OC (y-axis) populations. Units and colors are as in A and B. (D) Boxplot of rates of DNA methylation change for the 363 loci found in common between the SSC and T1D studies (left) and the 325 loci found in common between the SSC and OC studies. The rates of DNAm change for these loci are also shown for the CHB population.


