
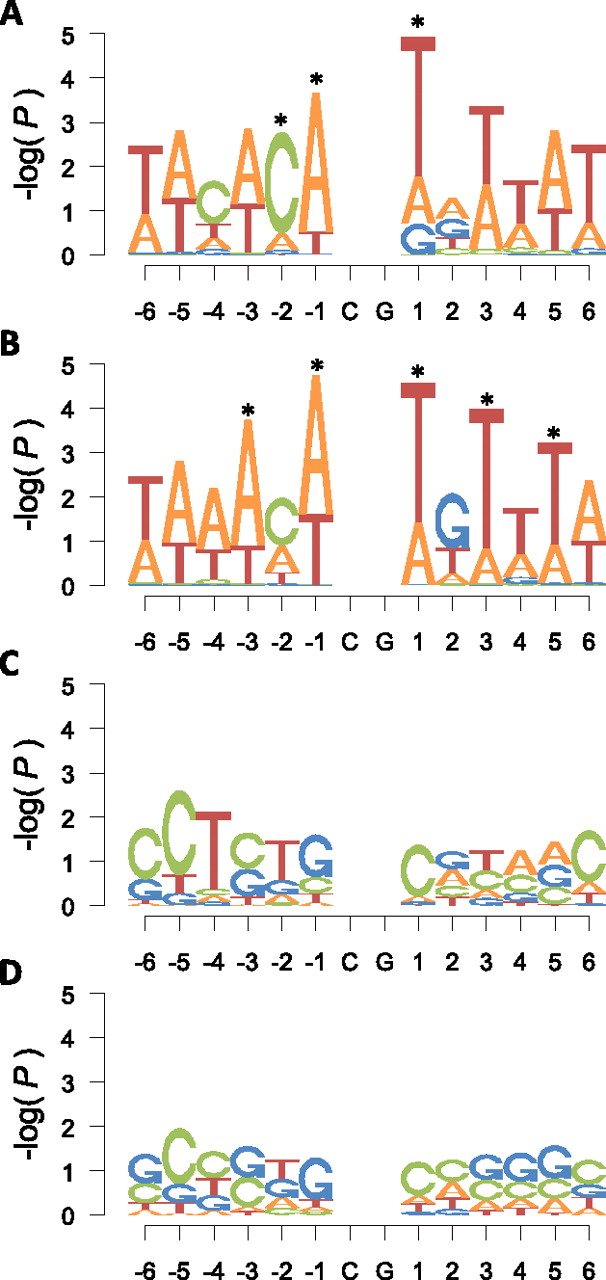
Figure 4.
Nucleotide composition surrounding age-associated loci. Logo plots of nucleotide composition immediately adjacent to age-demethylated (A,B) and age-methylated (C,D) CpG loci in the SSC (A,C) and CHB (B,D) populations. The height of each letter represents the significance [−log(P-value)] of overrepresentation for each base at the given location. Significance is determined by permutation testing relative to the assay composition.


