
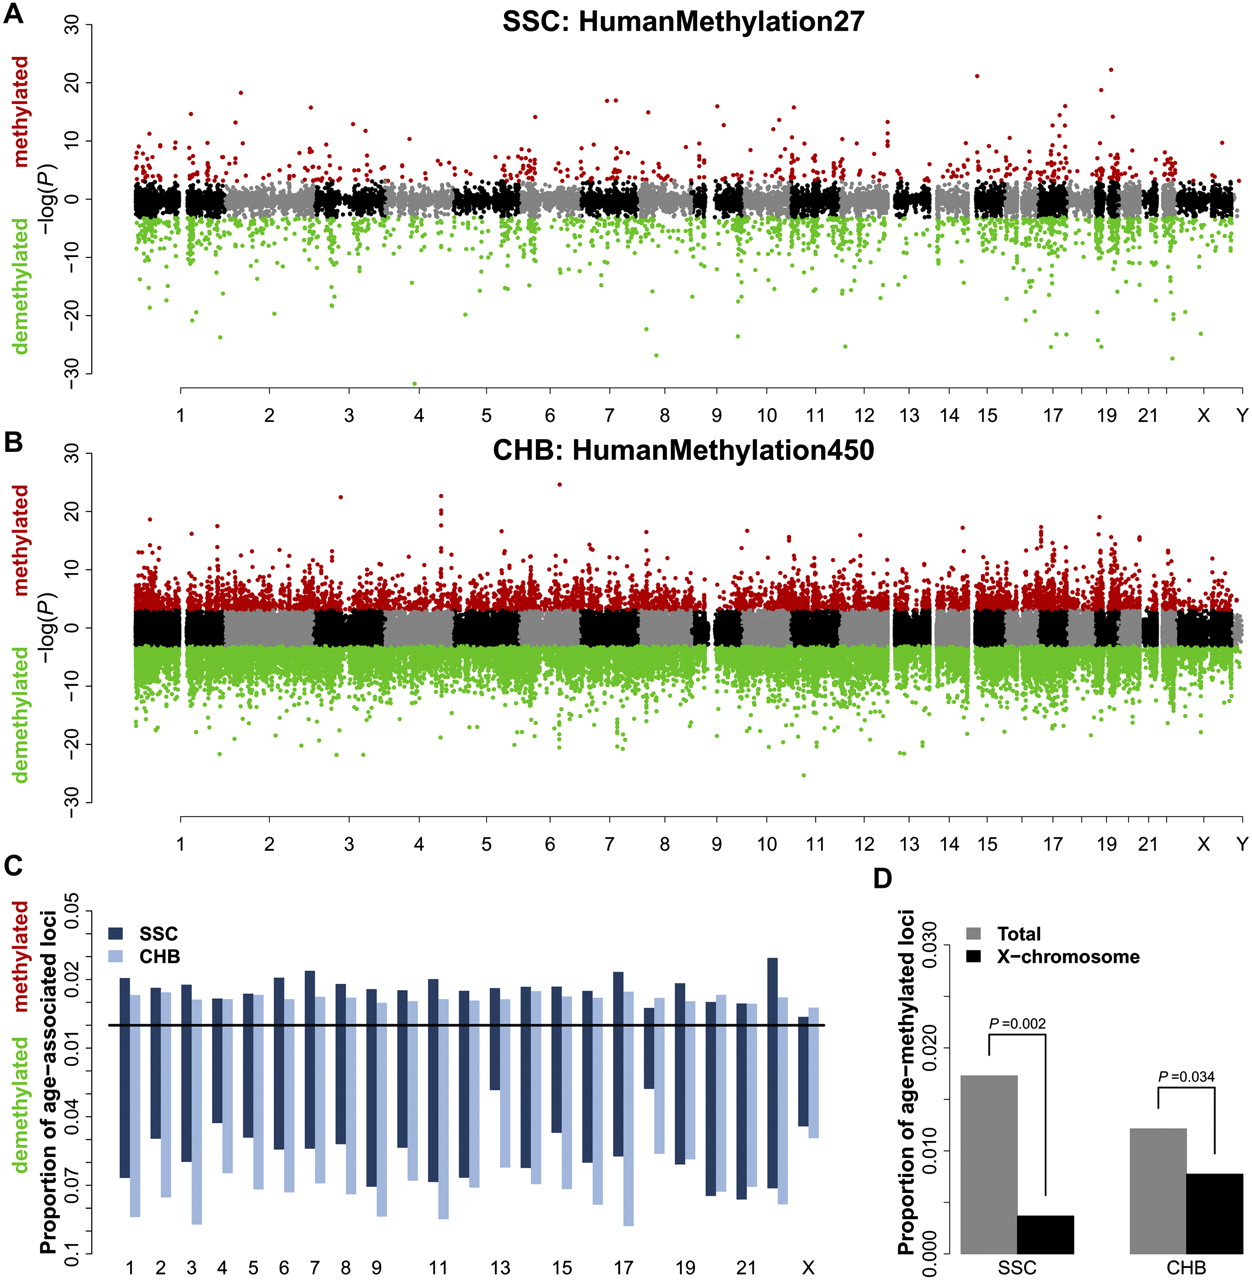
Pediatric age-associated loci by chromosome. (A,B) Modified Manhattan plots of age-associated loci in the SSC (A) and CHB (B) populations: loci positively correlated with age are displayed with a positive −log(P-value), and loci negatively correlated with age are displayed with a negative −log(P-value). Loci significantly age-methylated (red) or age-demethylated (green) (FDR < 0.01); otherwise loci are black or gray on alternating chromosomes. (C) Proportion of age-associated loci by chromosome in the SSC (dark blue) and CHB (light blue) populations: the proportion of age-methylated loci is displayed on the positive y-axis and age-demethylated loci on the negative y-axis. The Y chromosome is not shown because only seven probes are available in the SSC data. (D) Proportion of X-chromosome probes (black) that undergo age-methylation events compared with the proportion of all probes (gray) on the available assays for the SSC (left) and CHB (right) data sets. P-values are calculated by permutation testing.


