
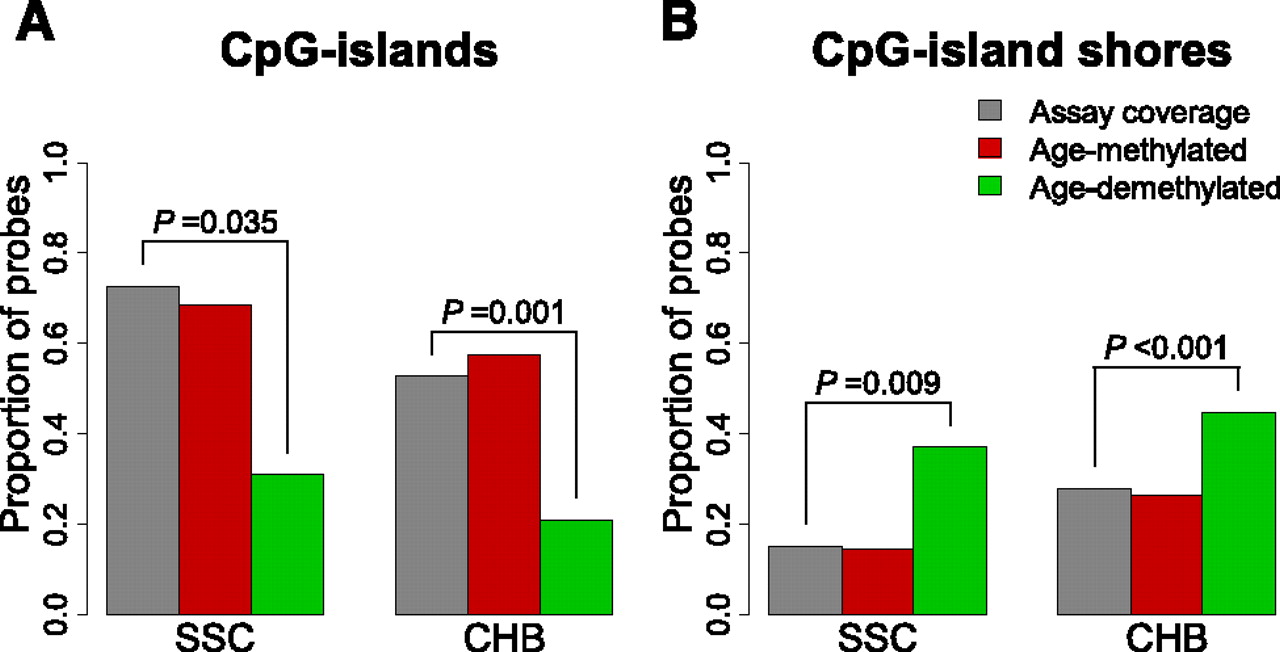
Figure 2.
Proportion of age-associated loci in CpG islands and “shores” in the SSC and CHB cohorts. Barplots of the proportion of age-methylated (red) and age-demethylated (green) loci relative to total assay coverage (gray) found in CpG islands (A) and CpG island “shores” (B). Significant permutation P-values are displayed.


