
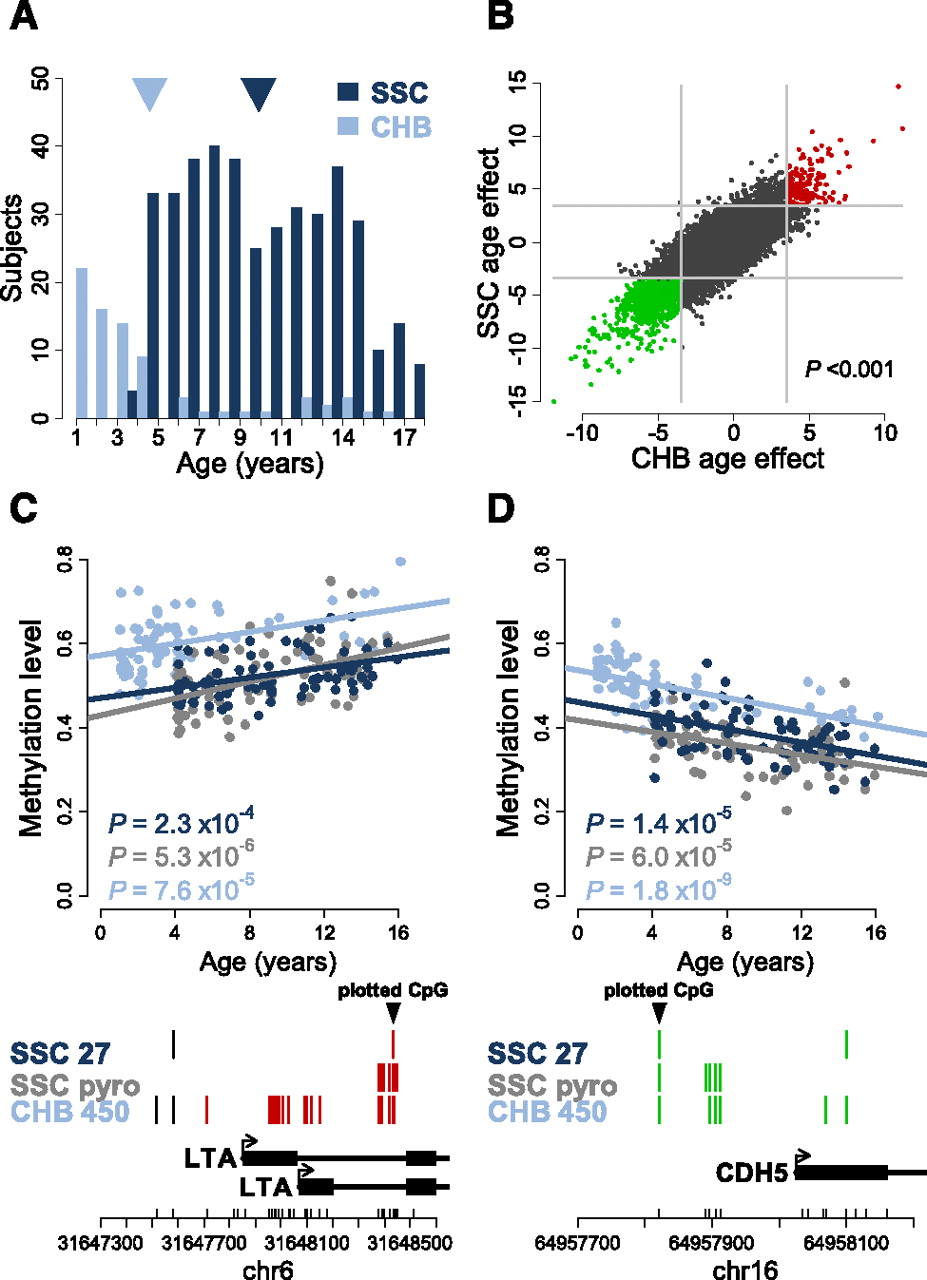
Pediatric age-associated DNA methylation. (A) Age distribution of the 398 Simons Simplex Collection (SCC: dark blue) and 78 Children's Hospital Boston (CHB: light blue) pediatric subjects, with mean ages denoted by arrowheads (dark blue and light blue, respectively). (B) Scatterplot of the age effect as measured by the age-associated t-statistic for the SSC (y-axis) and CHB (x-axis) populations. Each point represents one CpG locus interrogated by both assays and those loci found to be significant (FDR < 0.01) in both populations are red (age-methylated) or green (age-demethylated). (Light gray lines) The significance thresholds in each population; the P-value is the significance of the correlation, as determined by permutation testing. (C,D) Validation of representative age-associated loci in the SSC population, with the CHB data overlaid for comparison. Infinium HumanMethylation27 (SSC Inf27: dark blue) and pyrosequencing (SSC pyro: gray) data are shown for the subset of 75 individuals from the SSC population. In addition, the same loci are shown for the entire CHB population (N = 78), run on the HumanMethylation450 (Inf450: light blue). Lines represent the linear regression of each set of data independently; the P-values are the age-effect significance in the population shown. The y-axis is the methylation level measured by all three assays. Below each plot is a schematic of the interrogated locus and annotated genes in the region. (Black triangle) The CpG locus shown in the above plot; CpG coverage of each assay is denoted by vertical lines, with red denoting a significant (FDR<0.01) age-methylating effect, and green a significant age-demethylating effect; those in black are not significantly associated with age. The chromosome (chr), total CpGs in the region (small vertical black lines), and relative genomic coordinates (NCBI build 36.1) are denoted on the x-axis below the gene schematic.


