
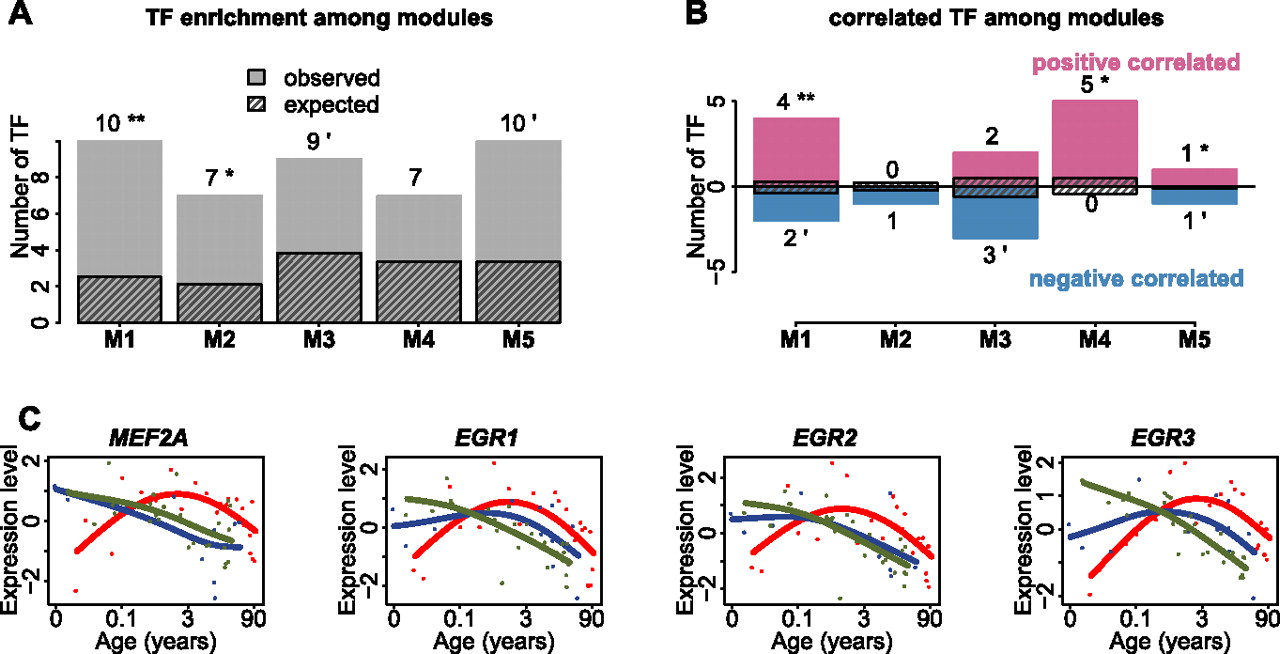
Regulation of human-specific expression patterns by TFs. (A) Number of TFs with TFBSs enriched among genes within each of the five human-specific expression modules in the PFC. The streaked bars represent the mean number of enriched TFs expected by chance, calculated by 1000 random assignments of the PFC age-related genes to the five modules. The numbers and symbols above each bar show numbers of TFs with enriched TFBSs among module genes (one-sided hypergeometric test, P < 0.05), as well as the significance of the number of TFs based on the 1000 permutations (**P < 0.01, *P < 0.05). (B) Number of TFs with TFBSs enriched and correlated with the targets in the same modules. The streaked bars represent the mean number of correlated TFs expected by chance, calculated by 1000 random assignments of the PFC age-related genes to the five modules. The numbers and symbols above each bar show numbers of correlated TFs among module genes (one-sided Wilcoxon test, P < 0.05), as well as the significance of the number of correlated TFs based on the 1000 permutations (**P < 0.01, *P < 0.05). (C) Expression profile of the four TFs showing significant positive correlation with their target gene expression profiles in all species in module 1. Points indicate individuals (red, human; blue, chimpanzee; green, macaque); lines show cubic spline curves. Note that MEF2A is a module 1 member, whereas EGR1-3 failed by a small margin to be classified as human-specific based on our criteria.


