
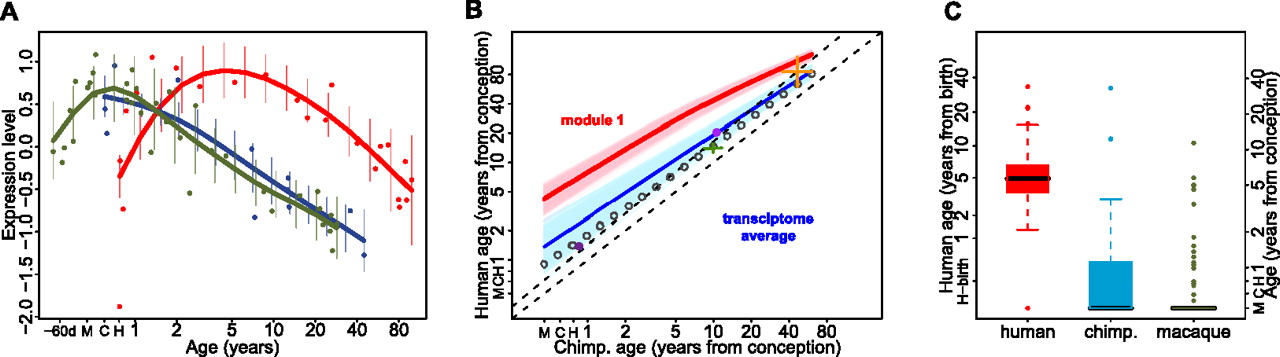
Time-shift in expression of module 1 genes among species. (A) Module 1 gene expression including the fetal rhesus macaque samples. Points indicate individuals (red, human; blue, chimpanzee; green, macaque), lines show cubic spline curves. (Error bars) SD across genes in a module. (B) Difference in developmental timing between humans and chimpanzees for PFC module 1 genes (red) and for all age-related genes in the PFC (transcriptome average; blue). The x- and y-axes show human and chimpanzee age in years from estimated conception event. H, C, and M axis marks show the time of birth for human, chimpanzee, and macaque, respectively. The curves show at what age human expression levels correspond to those of chimpanzee, estimated by aligning the chimpanzee and human expression profiles using the dynamic time warping algorithm. The light red and blue areas show variation in the module 1 time-shift estimate and the transcriptome average's time-shift estimate, respectively, obtained by bootstrapping module 1 genes or random assignments of PFC age-related genes to module 1, 1000 times. The other lines and symbols show timing of life history landmarks: Lower and upper black dashed lines show the diagonal line passing through the origin and the maximum lifespan point, respectively. Empty gray circles represent the timing of human brain growth relative to that of chimpanzees, using the dynamic time warping algorithm (data from Leigh 2004). The symbols represent the following life history landmarks: maximum lifespan (orange), female sexual maturity (green), and eruption of first deciduous and last permanent dentition (dark and light purple, respectively) (data from Smith et al. 1994; de Magalhães and Costa 2009). Note that the transcriptome average (dark blue curve) being above the diagonal indicates that humans reach the same expression levels at a later age than chimpanzees. Further, this developmental delay is significantly greater for module 1 (red curve) than for the transcriptome average. (C) The boxplot shows the distribution of ages at which expression of PFC module 1 genes reaches its maximum (red, human; blue, chimpanzee; green, macaque). The left and right y-axes show ages in years from birth for humans and from estimated conception time, respectively. H, C, and M indicate birth age for humans, chimpanzees, and macaques, respectively.


