
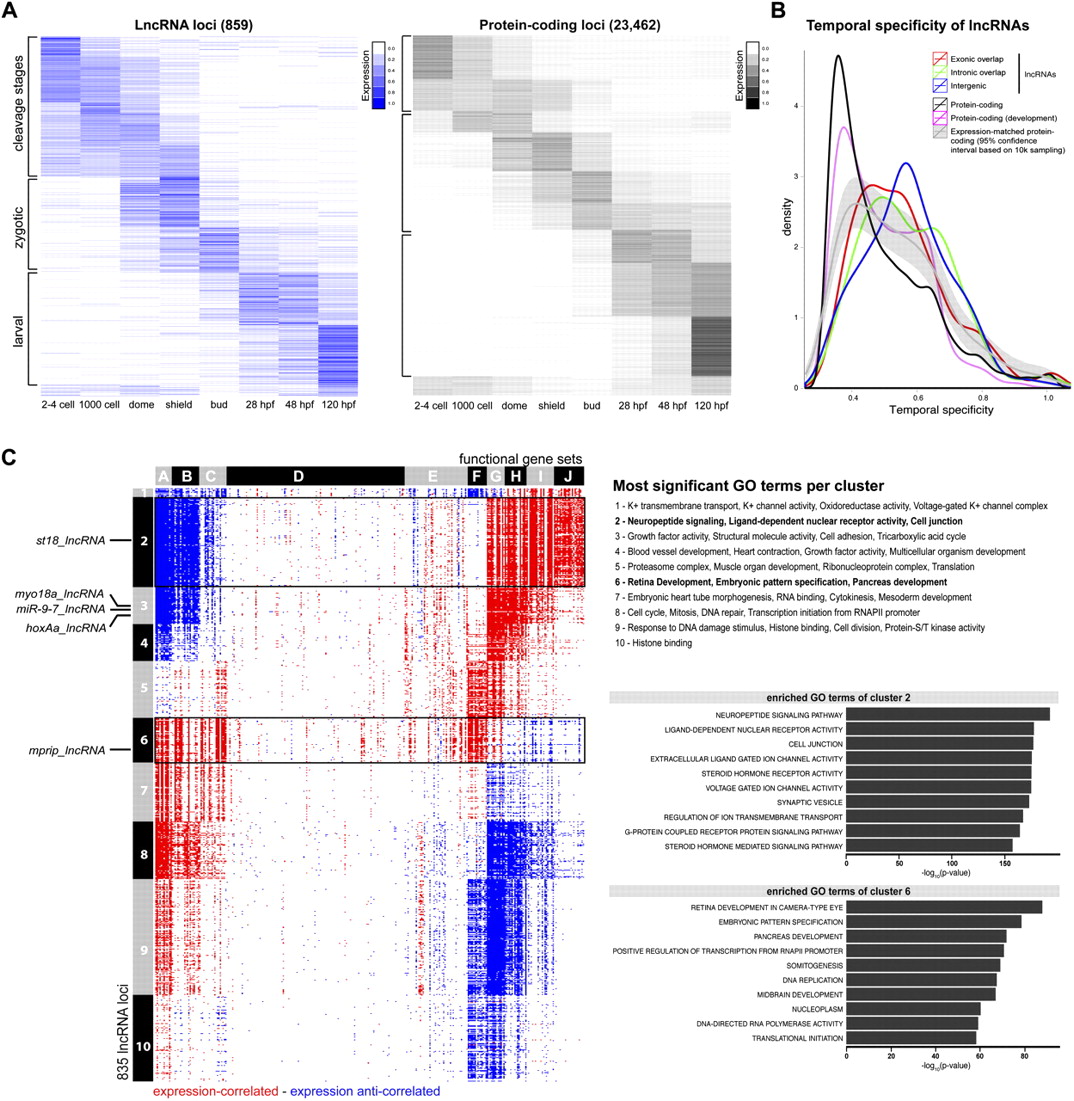
Temporal expression profiles of lncRNA genes compared to protein-coding genes. (A) Dynamic changes in expression profiles of loci (rows) across eight embryonic stages (columns). Heatmaps of 859 lncRNA loci (blue; left) and 23,462 protein-coding loci (gray; right) show normalized expression values (the sum of expression across all stages per locus is set to one). Three main expression patterns can be distinguished: “cleavage stages” (transcripts present in two- to four-cell-stage embryos), “zygotic” (transcripts enriched during blastula and gastrula stages and absent/only present at low levels at the two- to four-cell stage), and “larval” (transcripts induced only 1 d after fertilization). Note that the fraction of parentally provided (cleavage stage) transcripts is higher for lncRNAs than for protein-coding transcripts. (B) Temporal restriction of expression. Shown are distributions of Shannon entropy-based temporal specificity scores that were calculated for distinct classes of lncRNA loci and protein-coding loci (see Methods): exonic overlapping antisense lncRNAs (red), intronic overlapping lncRNAs (green), intergenic lncRNAs (blue), all protein-coding loci (black), and protein-coding loci of similar expression levels as lncRNA loci (gray; 95% confidence interval based on 10,000-times sampling). All classes of lncRNA loci display higher temporal specificity than protein-coding loci. (C) Expression-based association matrix of 835 lncRNA loci (rows) and functional gene sets (columns), derived from gene set enrichment analysis (GSEA). (Red) Positive correlation; (blue) negative correlation; (white) no correlation. Rows corresponding to lncRNAs whose RNA expression pattern is shown by in situ hybridization in Figure 7 are indicated on the left. Black boxes highlight two clusters associated with functions in signaling (cluster 2) and development (cluster 6). (Top right) The most enriched GO terms per cluster in comparison to all other clusters. (Bottom right) The 10 most enriched GO terms in the two boxed clusters in comparison to all other clusters, ranked by their –log10(P-values).


