
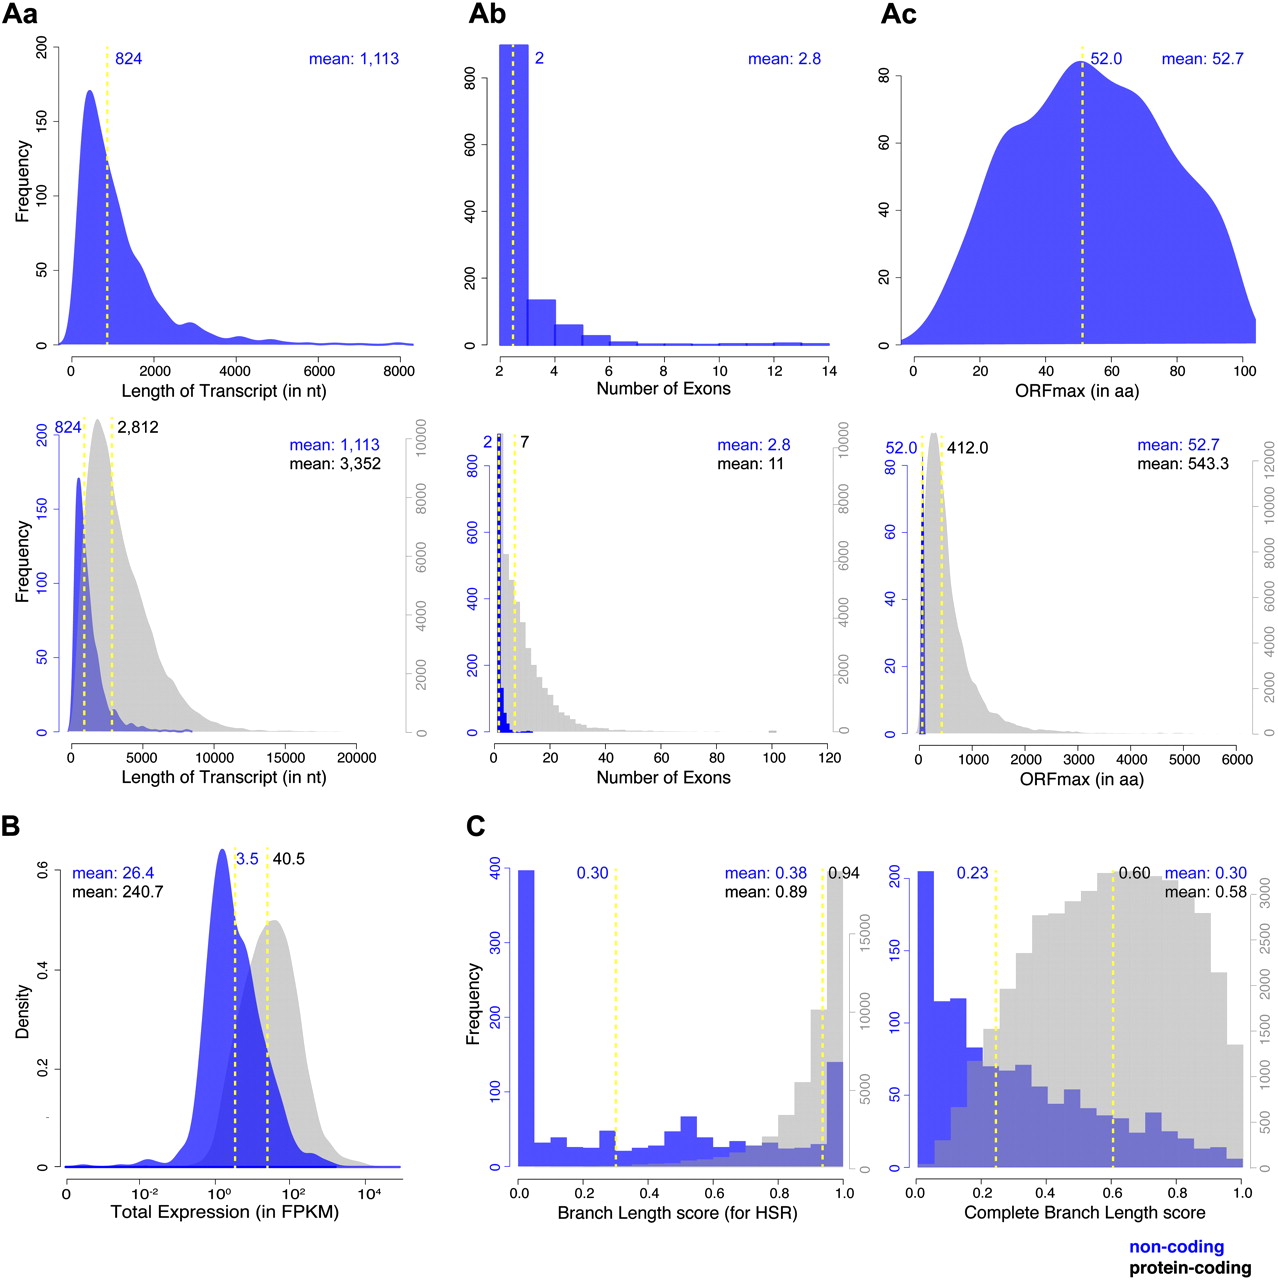
LncRNAs are shorter, less conserved, and expressed at lower levels than protein-coding genes. (A) Transcript length (a), number of exons (b), and maximum ORF length (ORFmax) (c) of the 1133 lncRNAs (top row) and of the 1133 lncRNAs (blue) in comparison to protein-coding transcripts (44,810 transcripts with PhyloCSF > 50; gray; bottom row). LncRNAs are generally shorter, have fewer exons, and contain shorter ORFs than protein-coding transcripts. Note that this might be an underestimation of the actual size of lncRNAs due to a potentially more incomplete assembly of low-expressed transcripts. (B) Comparison of the expression levels of lncRNA loci (859) and protein-coding loci (19,592 loci with PhyloCSF >50), plotted as fragments per kilobase of exon per million fragments mapped (FPKM). LncRNA loci are expressed at approximately 10-fold lower levels than the majority of protein-coding loci. (C) Comparison of the alignment quality across the locus of interest, assessed by two alternative measurements of the branch lengths present in the alignment. Branch lengths are measured on a scale from 0 to 1, where 0 indicates no alignments over the region of interest and 1 indicates the presence of 100% of sequence alignments. The branch length (BL) score refers to the alignment quality of the region that scores highest in PhyloCSF (the highest scoring region [HSR]; left). The complete branch length (CBL) score refers to the alignment quality over the entire length of the transcript (right). In the case of noncoding genes, alignments are poorer for the HSRs than for the entire gene length (BL scores < CBL scores). The reverse is true for protein-coding genes, which tend to have the best alignments over the HSRs (BL scores close to one). The values of the median (yellow dashed line) and mean are indicated in all panels.


