
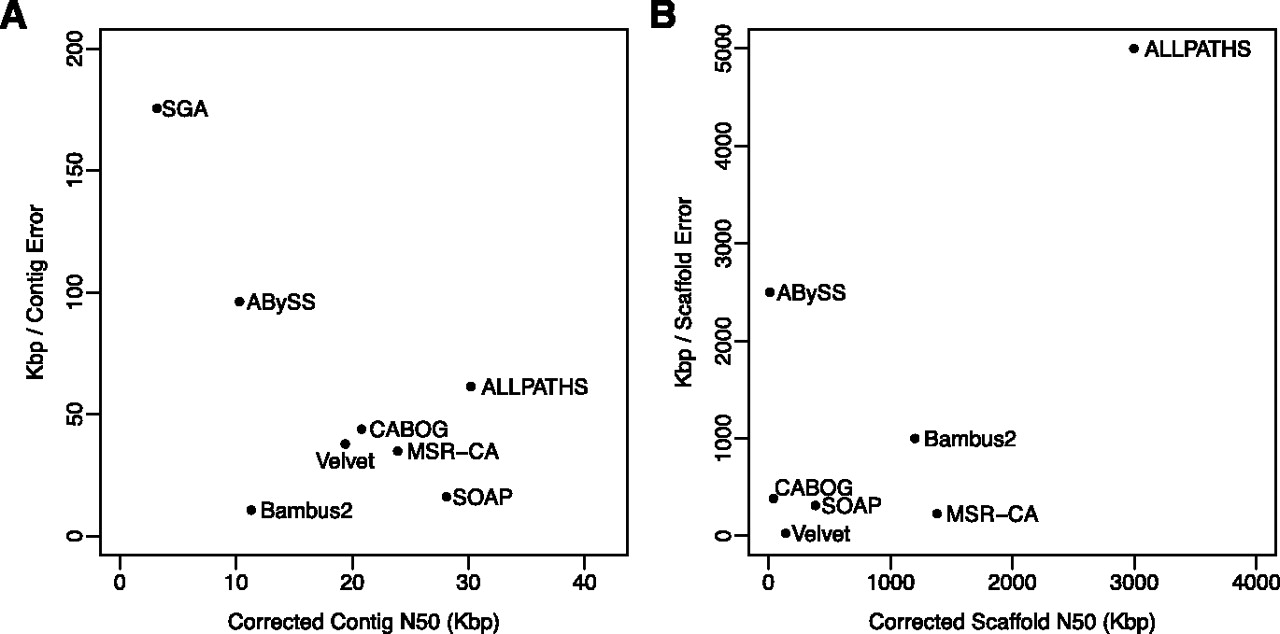
Figure 6.
Average contig (A) and scaffold (B) sizes, measured by N50 values, versus error rates, averaged over all three genomes for which the true assembly is known: S. aureus, R. sphaeroides, and human chromosome 14. Errors (vertical axis) are measured as the average distance between errors, in kilobases. N50 values represent the size N at which 50% of the genome is contained in contigs/scaffolds of length N or larger. In both plots, the best assemblers appear in the upper right.


