
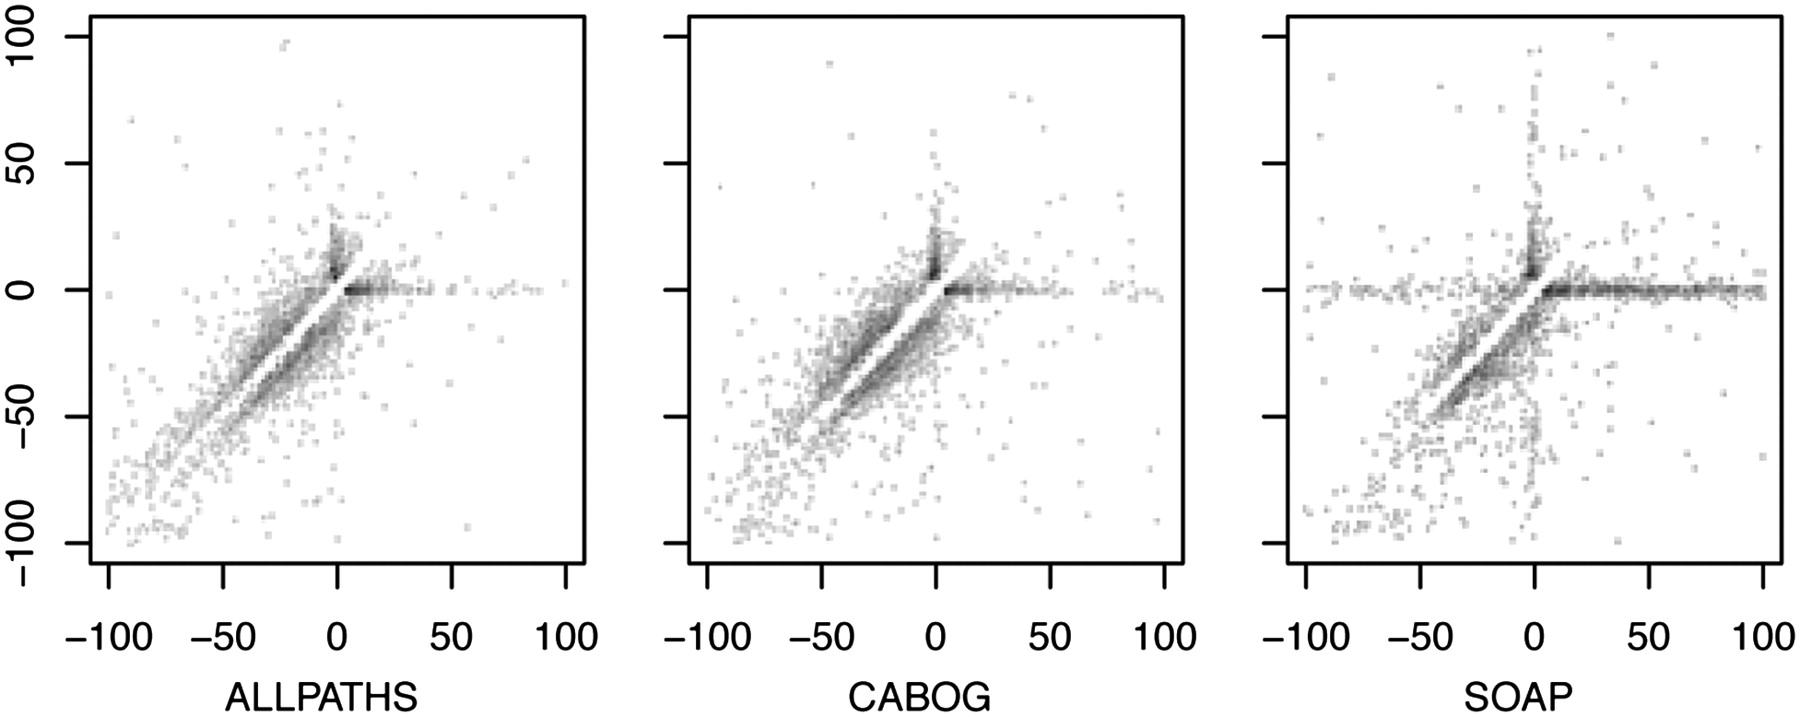
Comparison of the indel profiles for three assemblies of human Chr14. Every indel in the assembly is defined by the two aligned segments on either side. For each indel, the x-axis displays the distance between the two adjacent segments in the reference, and the y-axis displays the distance in the query. Thus, the point x = 100, y = 0 indicates a 100-bp deletion in the assembly, relative to the reference. Deletions from the assembly lie below the line y = x, and insertions in the assembly lie above. The indels can be roughly categorized by quadrant: (top right) divergent sequence; (bottom right) segmental assembly deletion; (bottom left) tandem repeat collapse/expansion; (top left) segmental assembly insertion. No points lie on the line y = x because only indels >5 bp are displayed. For details, see the Supplemental Methods.


