
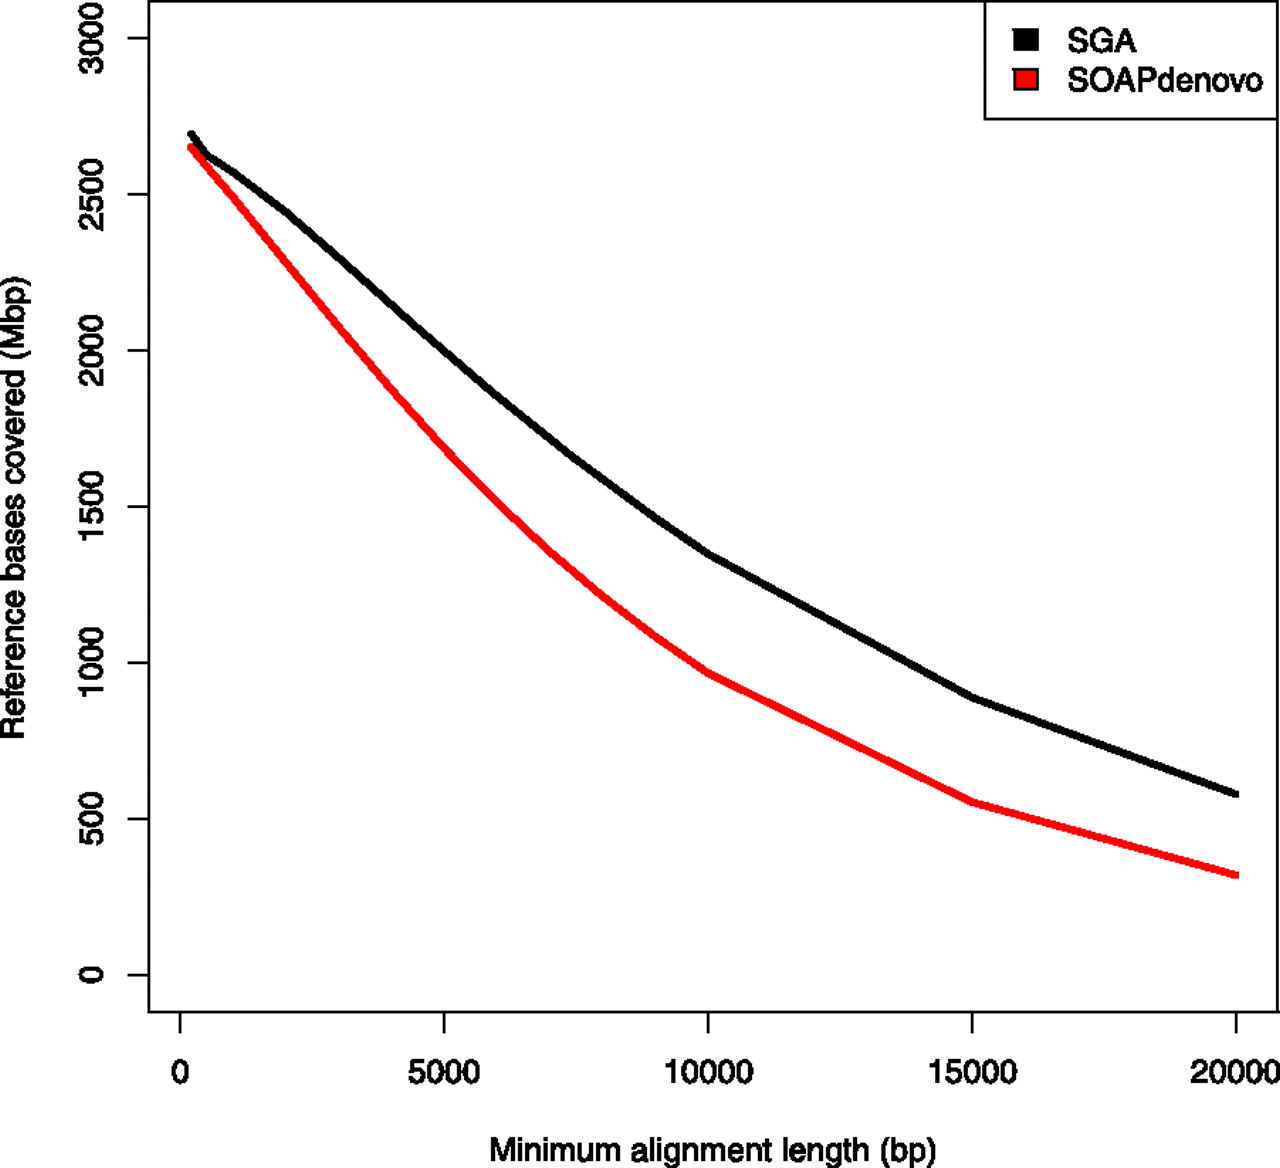
Figure 3.
The amount of the human reference genome covered by a contig as a function of the minimum contig alignment length. For each length L on the x-axis, contig alignments less than L bp in length were filtered out and the amount of the reference genome covered by the remaining alignments was calculated.


