
Figure 5.
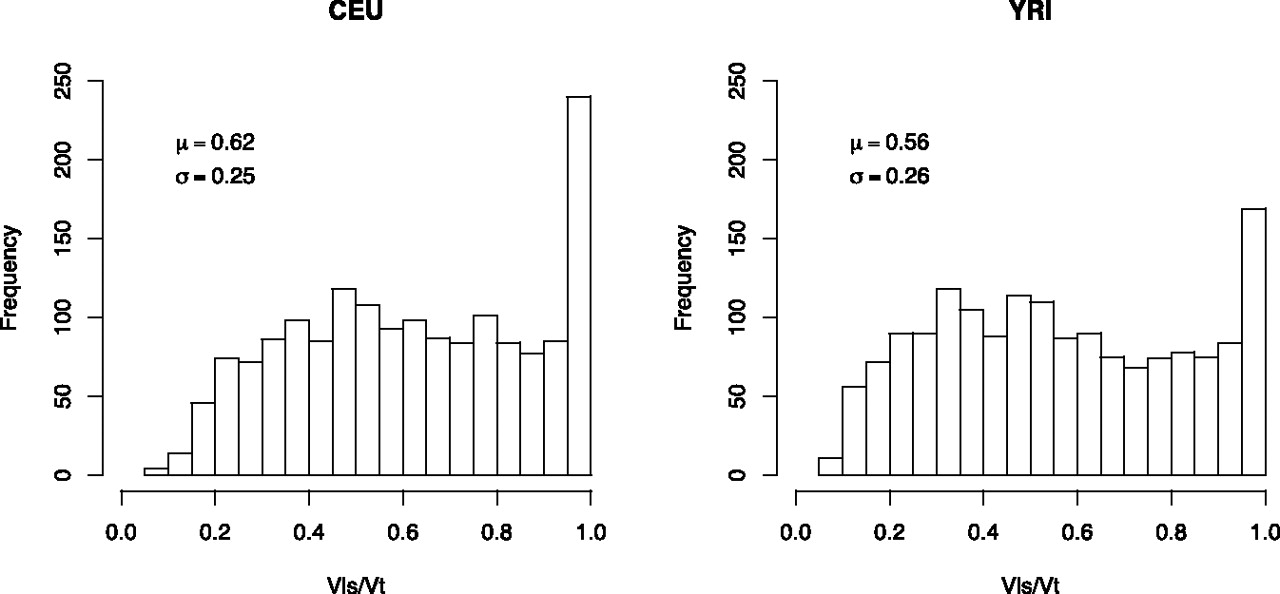
Variability in gene expression versus variability in alternative splicing as measured by Vls/Vt. See text for an explanation of the multiplicative model.
(Downloading may take up to 30 seconds. If the slide opens in your browser, select File -> Save As to save it.)
Click on image to view larger version.
Variability in gene expression versus variability in alternative splicing as measured by Vls/Vt. See text for an explanation of the multiplicative model.
 CiteULike
 Delicious
 Digg
Digg Facebook
 Google+
 Reddit
 Twitter
